GBP/JPY Price Forecast: On recovery, aiming for the 203.50 resistance area
- The Pound reached levels past 203.00 after bouncing at 201.85 lows on Friday.
- Growing political uncertainty in Japan is weighing on the Yen on Monday.
- GBP/JPY needs to break the 203.50 resistance to confirm a trade shift.
Pound’s reversal against the Yen found support near the 38.2% Fibonacci retracement, right below the 202.00 line, and is trading higher again on Monday. The pair has regained the 203.00 level and is approaching the 203.50 area, where it might find significant resistance.
The Japanese Yen is under pressure on Monday after the Komeito Party announced it will leave the governing coalition due to divergences with the new LDP leader, Sanae Takaichi, deepening the country’s political uncertainty.
Technical analysis: GBP/JPY needs to break 203.50 to confirm a trend shift
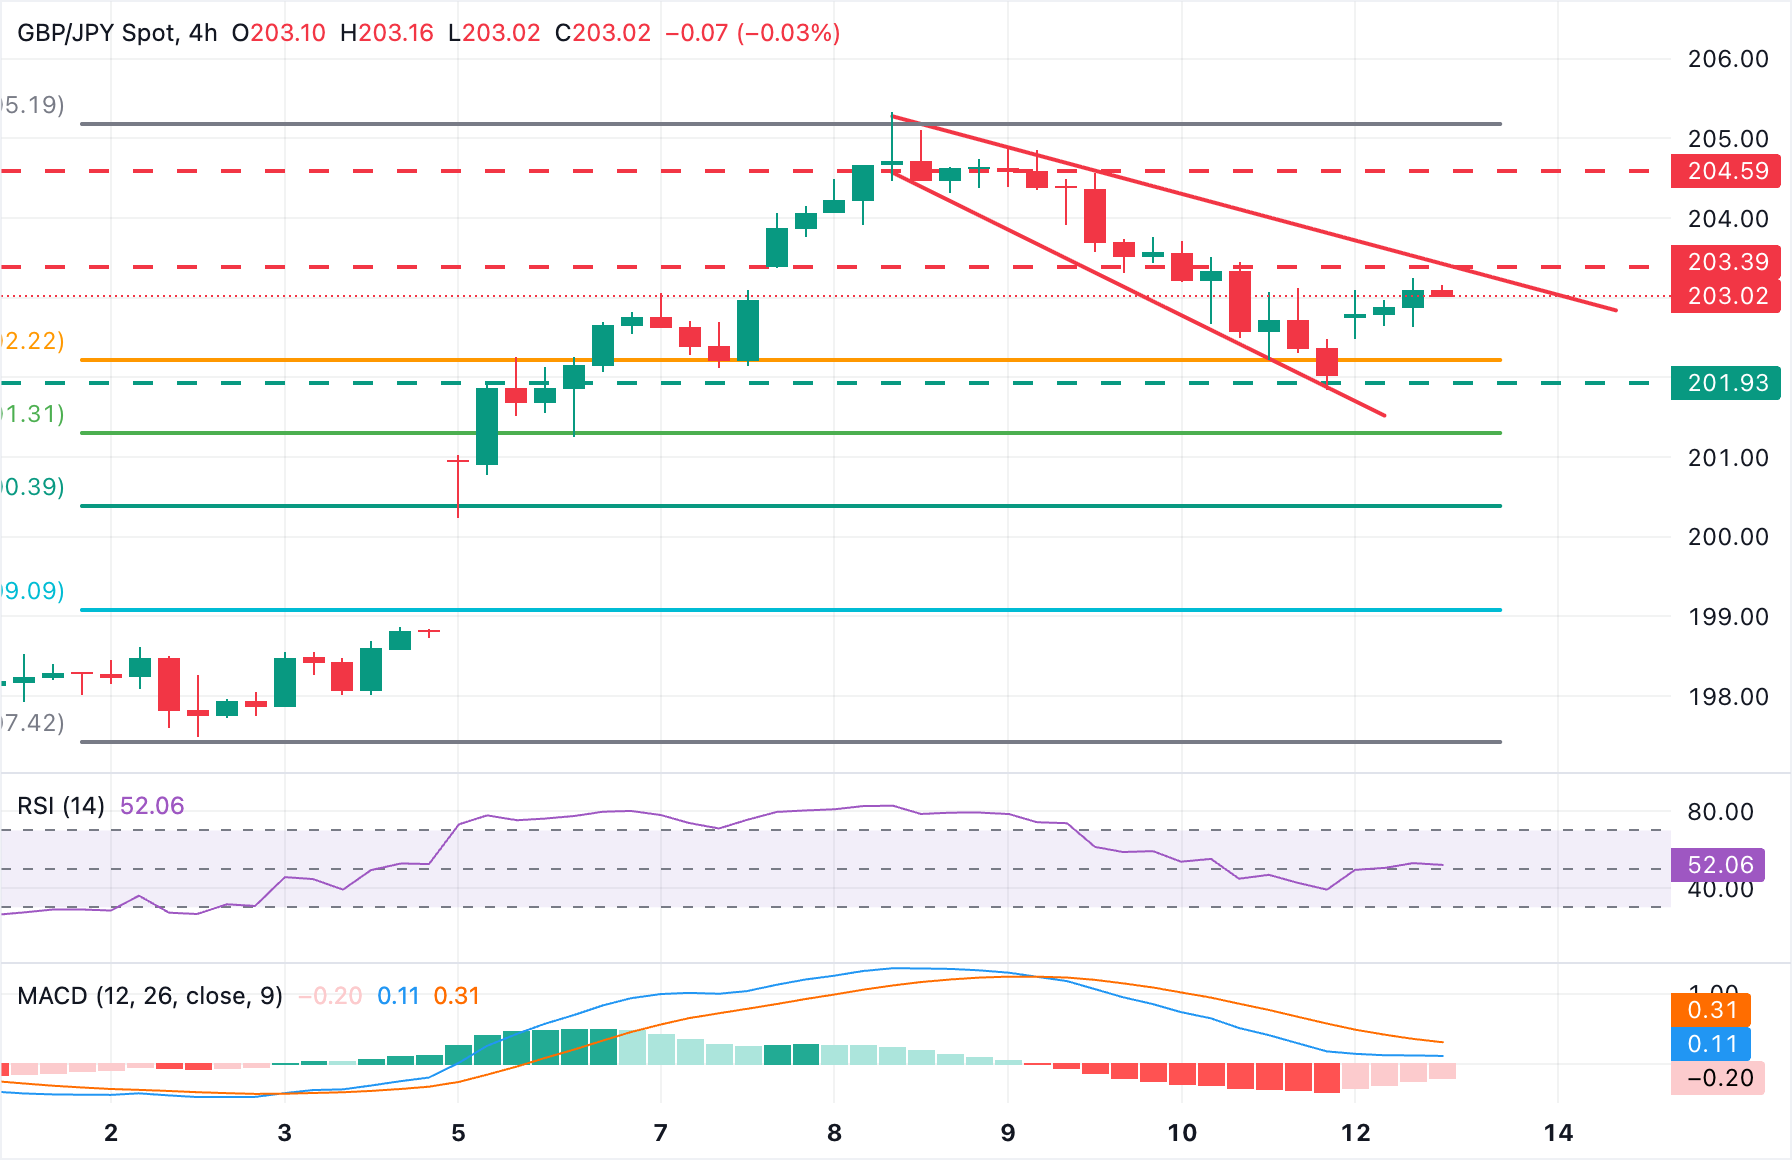
The technical picture shows easing bearish pressure. The 4-Hour RSD has popped up above the key 50 level, and the MACD in the same timeframe is turning higher.
Bulls, however, will need to breach the resistance area around 203.50, where the trendline resistance from last week’s highs meets the October 10 high, to confirm the trend shift. Further up, the intraday resistance, at 204.55, and the October 8 high, at 205.20, will come into focus.
On the downside, immediate support is at Friday’s low of 201.85. Below there, bears would be enticed to the 50% Fibonacci retracement, at 201.35, and the 61.8% Fibonacci retracement, which meets October 5 lows at the 200.30 area.
Japanese Yen Price Today
The table below shows the percentage change of Japanese Yen (JPY) against listed major currencies today. Japanese Yen was the strongest against the New Zealand Dollar.
| USD | EUR | GBP | JPY | CAD | AUD | NZD | CHF | |
|---|---|---|---|---|---|---|---|---|
| USD | 0.16% | 0.12% | 0.23% | 0.08% | -0.17% | 0.17% | 0.19% | |
| EUR | -0.16% | -0.04% | 0.11% | -0.09% | -0.25% | 0.00% | 0.01% | |
| GBP | -0.12% | 0.04% | 0.18% | -0.04% | -0.22% | 0.05% | 0.03% | |
| JPY | -0.23% | -0.11% | -0.18% | -0.20% | -0.45% | -0.02% | -0.09% | |
| CAD | -0.08% | 0.09% | 0.04% | 0.20% | -0.29% | 0.10% | 0.08% | |
| AUD | 0.17% | 0.25% | 0.22% | 0.45% | 0.29% | 0.27% | 0.25% | |
| NZD | -0.17% | -0.01% | -0.05% | 0.02% | -0.10% | -0.27% | -0.02% | |
| CHF | -0.19% | -0.01% | -0.03% | 0.09% | -0.08% | -0.25% | 0.02% |
The heat map shows percentage changes of major currencies against each other. The base currency is picked from the left column, while the quote currency is picked from the top row. For example, if you pick the Japanese Yen from the left column and move along the horizontal line to the US Dollar, the percentage change displayed in the box will represent JPY (base)/USD (quote).
.
Author

Guillermo Alcala
FXStreet
Graduated in Communication Sciences at the Universidad del Pais Vasco and Universiteit van Amsterdam, Guillermo has been working as financial news editor and copywriter in diverse Forex-related firms, like FXStreet and Kantox.