GBP/JPY Price Forecast: Key resistance remains at the 200.35-200.50 area
- The Pound bounced up on Yen weakness, but is struggling to find acceptance above 200.00.
- Moderate Tokyo inflation levels have dampened hopes of BoJ tightening in October.
- GBP/JPY: key resistance lies ahead of 200.50, support is at the 199.20 area.

The British Pound is trimming Thursday’s losses on Friday, favoured by generalised Japanese Yen weakness, following relatively soft inflation figures in the Tokyo area. The pair has reached prices above the 200.00 level after bouncing at 199.55, but remains below a key resistance area ahead of 200.50
Data released on Thursday revealed that the advanced Tokyo CPI grew at a 2.5% yearly rate in September, down from 2.6% in August. The Core CPI remained steady at 2.5% against market expectations of an uptick to 2.6%. These figures give some more leeway to the BoJ to maintain its “wait-and-see” stance at its next monetary policy meeting, and have increased bearish pressure on the Yen.
Technical analysis: Looking for direction around 200.00
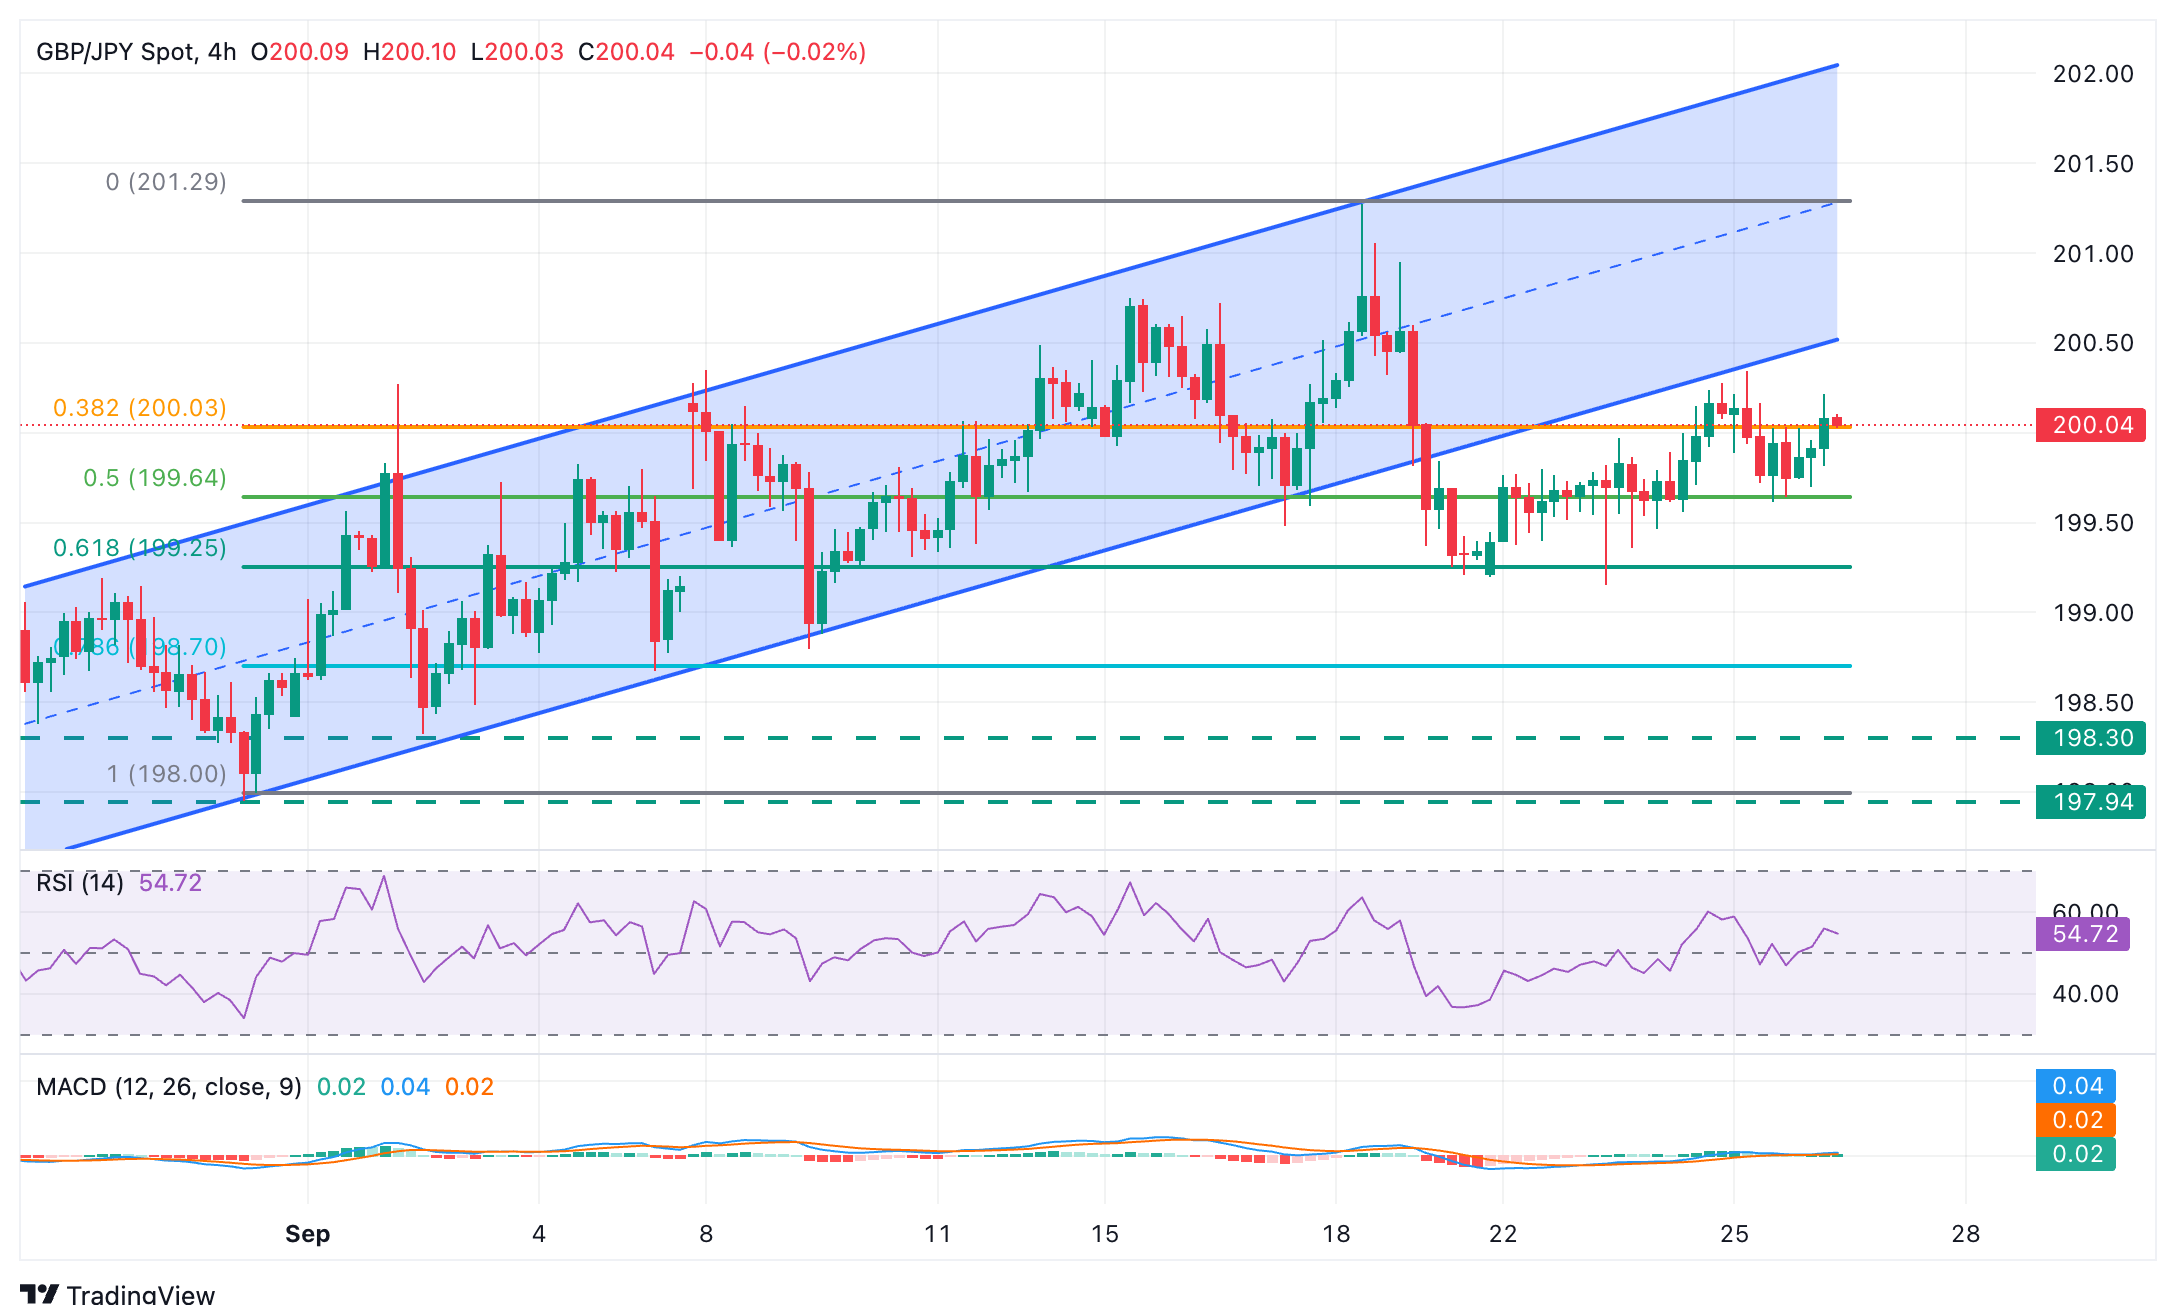
The technical picture is mixed. The pair broke below an ascending trendline support, yet bears have been unable to pull the pair below 199.20. The 4-hour Relative Strength Index is wavering around the 50 level, indicating a lack of a clear bias.
Bulls will find significant resistance in the area between Thursday’s high, at 200.35, and the reverse trendline, now around 200.50. A confirmation above here would open the way towards the year-to-date high, at 201.27.
A reversal from current levels, on the contrary, would face support at the mentioned 199.20 (September 19 and 23 lows). Further down, the 78.6% retracement of the September rally, which meets the September 5 low at 198.65, and the September 2 low at 198.35, would be the next bearish targets.
(This story was corrected on September 26 at 10:10 GMT to say that the September 5 low is at 198.65 and the September 2 at 198.35, not at 168.65 and 1.1830 as previously reported.)
Japanese Yen Price Today
The table below shows the percentage change of Japanese Yen (JPY) against listed major currencies today. Japanese Yen was the strongest against the New Zealand Dollar.
| USD | EUR | GBP | JPY | CAD | AUD | NZD | CHF | |
|---|---|---|---|---|---|---|---|---|
| USD | -0.12% | -0.11% | -0.12% | 0.07% | 0.00% | 0.07% | -0.06% | |
| EUR | 0.12% | 0.05% | 0.07% | 0.24% | 0.20% | 0.25% | 0.08% | |
| GBP | 0.11% | -0.05% | 0.08% | 0.19% | 0.23% | 0.20% | -0.00% | |
| JPY | 0.12% | -0.07% | -0.08% | 0.15% | 0.09% | 0.16% | -0.09% | |
| CAD | -0.07% | -0.24% | -0.19% | -0.15% | -0.06% | 0.03% | -0.19% | |
| AUD | -0.01% | -0.20% | -0.23% | -0.09% | 0.06% | 0.05% | -0.15% | |
| NZD | -0.07% | -0.25% | -0.20% | -0.16% | -0.03% | -0.05% | -0.09% | |
| CHF | 0.06% | -0.08% | 0.00% | 0.09% | 0.19% | 0.15% | 0.09% |
The heat map shows percentage changes of major currencies against each other. The base currency is picked from the left column, while the quote currency is picked from the top row. For example, if you pick the Japanese Yen from the left column and move along the horizontal line to the US Dollar, the percentage change displayed in the box will represent JPY (base)/USD (quote).
Author

Guillermo Alcala
FXStreet
Graduated in Communication Sciences at the Universidad del Pais Vasco and Universiteit van Amsterdam, Guillermo has been working as financial news editor and copywriter in diverse Forex-related firms, like FXStreet and Kantox.
















