GBP/JPY Price Forecast: Bulls face strong resistance at 200.30
- Pound bulls have been capped at 200.30 again on Monday, before retreating to 199.45.
- The Yen depreciated across the board after news of Prime Minister Ishiba's resignation.
- Key GBP/JPY support is at the ascending trendline, now at the 199.00 area.

The British Pound attempted to appreciate against a weaker Yen in the early morning trade, but sellers appeared at the 200.30 area, sending the pair 0.15% lower to the mid-range of the 199.00s.
The Japanese Yen depreciated across the board in early trading as investors reacted to the announcement of Prime Minister Ishiba’s resignation and the chances that former foreign minister Toshimutsu Motegi would replace him. Mortegi’s support for a loose monetary policy would put BoJ’s monetary tightening plans into question.
Technical analysis: The immediate bullish trend remains intact
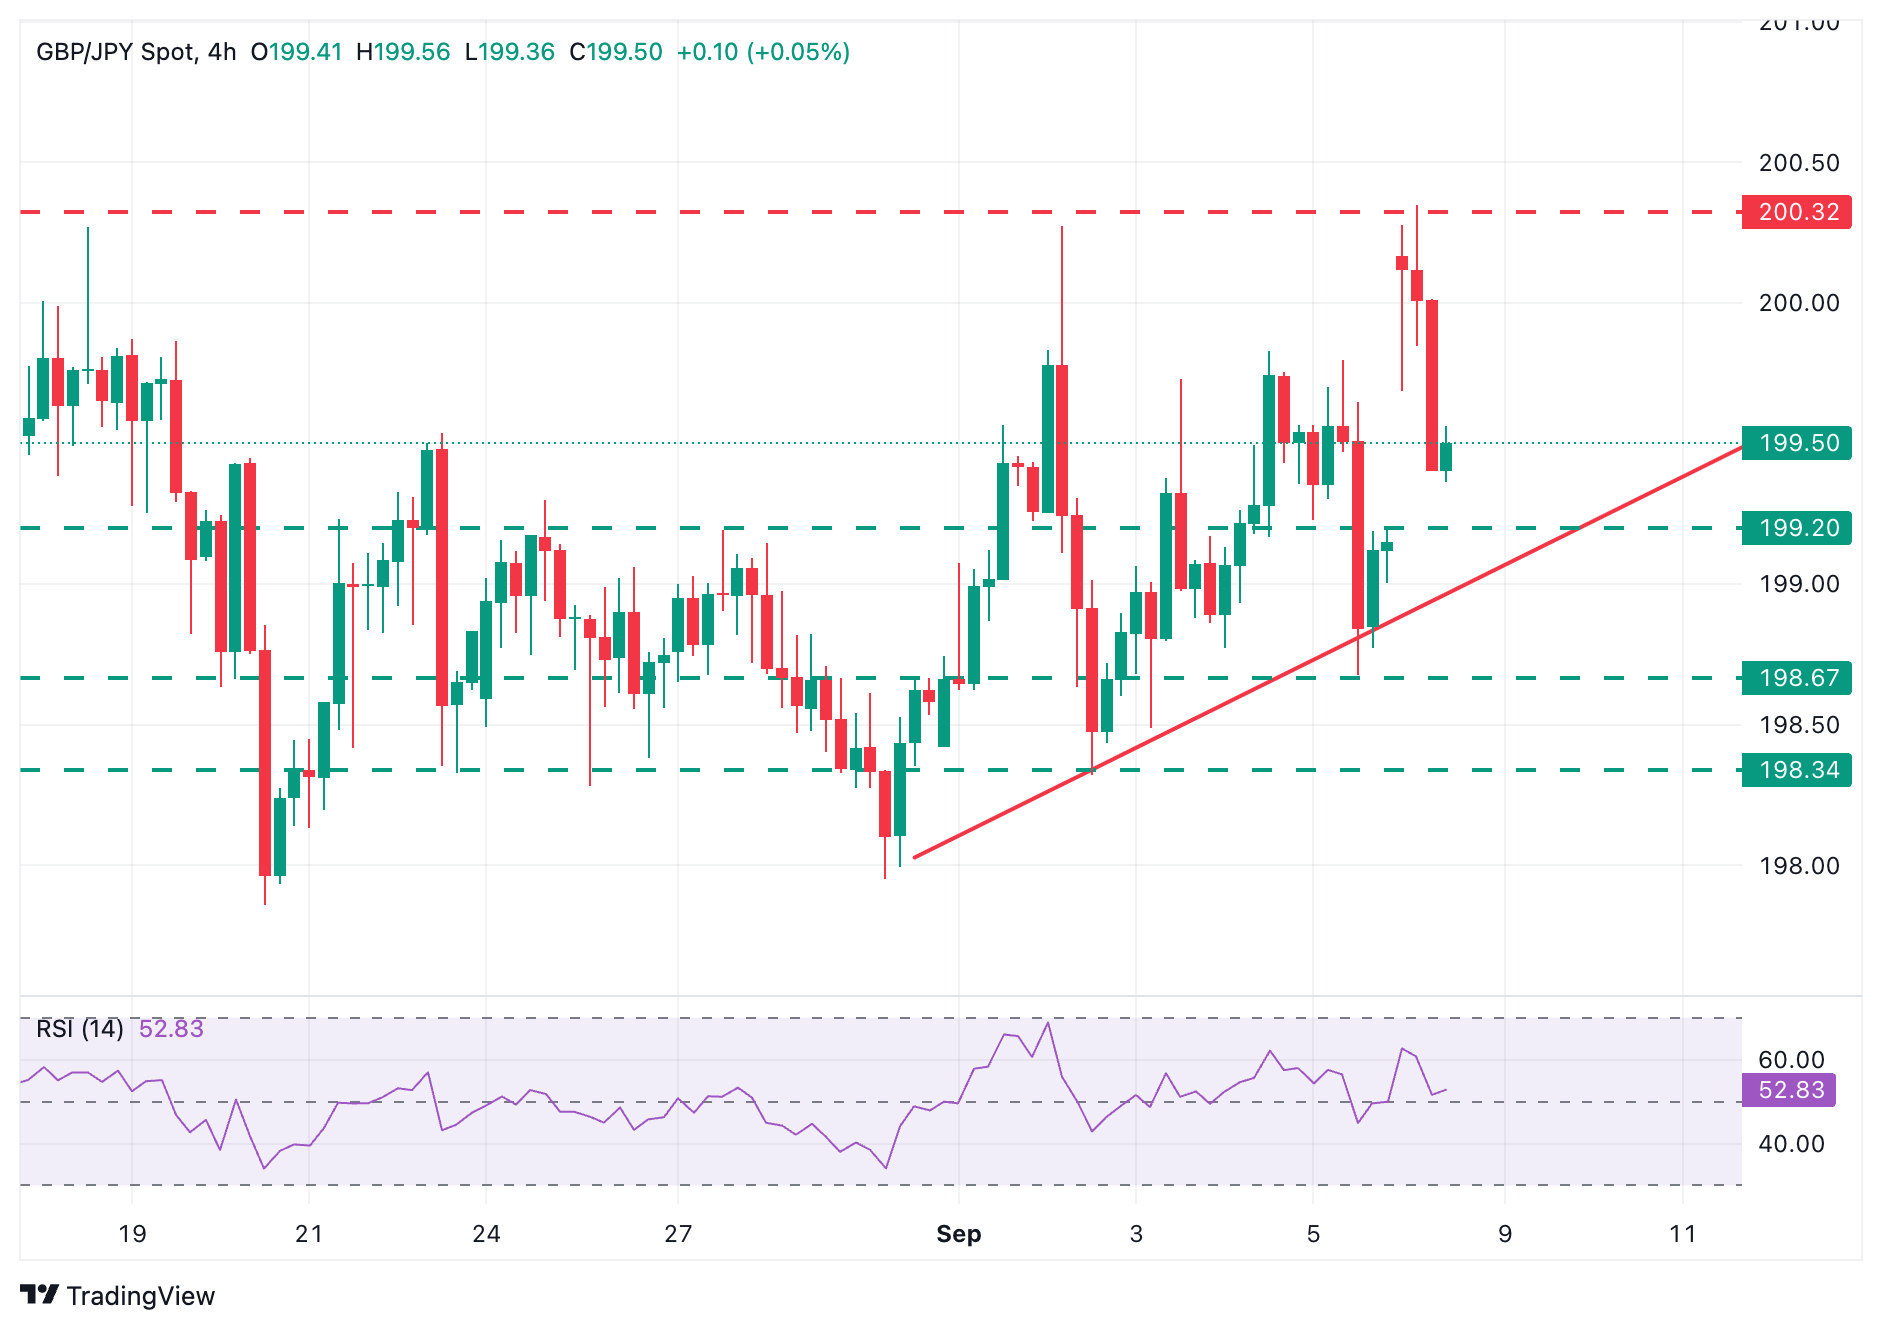
The broad picture shows the pair trading sideways below the mentioned 200.30 resistance level, but the immediate trend remains intact, with the pair printing higher highs and higher lows from last week.
The 200.30 level, however, capped upside attempts on August 13 and 18, as well as on September 2 and is likely to be a tough hurdle. Above here, the next target would be the 127.2% Fibonacci retracement of the mid-August reversal, at 200.95.
To the downside, the pair has a gap at the 199.20 level, and gapps tend to close. A trendline support from the September 2 low lies at 199.00. Below here, the September 5 low, at 198.70, and the September 3 low at 198.35 are likely to attract bearish pressure.
Japanese Yen Price Today
The table below shows the percentage change of Japanese Yen (JPY) against listed major currencies today. Japanese Yen was the strongest against the US Dollar.
| USD | EUR | GBP | JPY | CAD | AUD | NZD | CHF | |
|---|---|---|---|---|---|---|---|---|
| USD | -0.16% | -0.04% | -0.40% | -0.11% | -0.45% | -0.49% | -0.34% | |
| EUR | 0.16% | 0.11% | -0.19% | 0.03% | -0.30% | -0.30% | -0.18% | |
| GBP | 0.04% | -0.11% | -0.38% | -0.07% | -0.40% | -0.40% | -0.28% | |
| JPY | 0.40% | 0.19% | 0.38% | 0.23% | -0.07% | -0.23% | 0.11% | |
| CAD | 0.11% | -0.03% | 0.07% | -0.23% | -0.25% | -0.33% | -0.23% | |
| AUD | 0.45% | 0.30% | 0.40% | 0.07% | 0.25% | 0.00% | 0.17% | |
| NZD | 0.49% | 0.30% | 0.40% | 0.23% | 0.33% | 0.00% | 0.13% | |
| CHF | 0.34% | 0.18% | 0.28% | -0.11% | 0.23% | -0.17% | -0.13% |
The heat map shows percentage changes of major currencies against each other. The base currency is picked from the left column, while the quote currency is picked from the top row. For example, if you pick the Japanese Yen from the left column and move along the horizontal line to the US Dollar, the percentage change displayed in the box will represent JPY (base)/USD (quote).
Author

Guillermo Alcala
FXStreet
Graduated in Communication Sciences at the Universidad del Pais Vasco and Universiteit van Amsterdam, Guillermo has been working as financial news editor and copywriter in diverse Forex-related firms, like FXStreet and Kantox.


