|

GBP/JPY Price Analysis: Trimmed last week’s losses, regains the 200-DMA

  • GBP/JPY registered hefty gains of 3.96% during the week.
  • Long-term, the GBP/JPY is neutral upwards, though if it clears 162.57, that could open the door for further gains.
  • Per the daily chart, if the GBP/JPY clears 162.25, the pair can rally towards 164.00.

The GBP/JPY advanced for the fourth straight day and reclaimed the 200-day EMA after hitting a daily low at around 159.43, though buyers stepped, sending the cross-currency pair towards its daily high of 162.17. At the time of writing, the GBP/JPY is trading at 161.54, above its opening price by 0.62%.

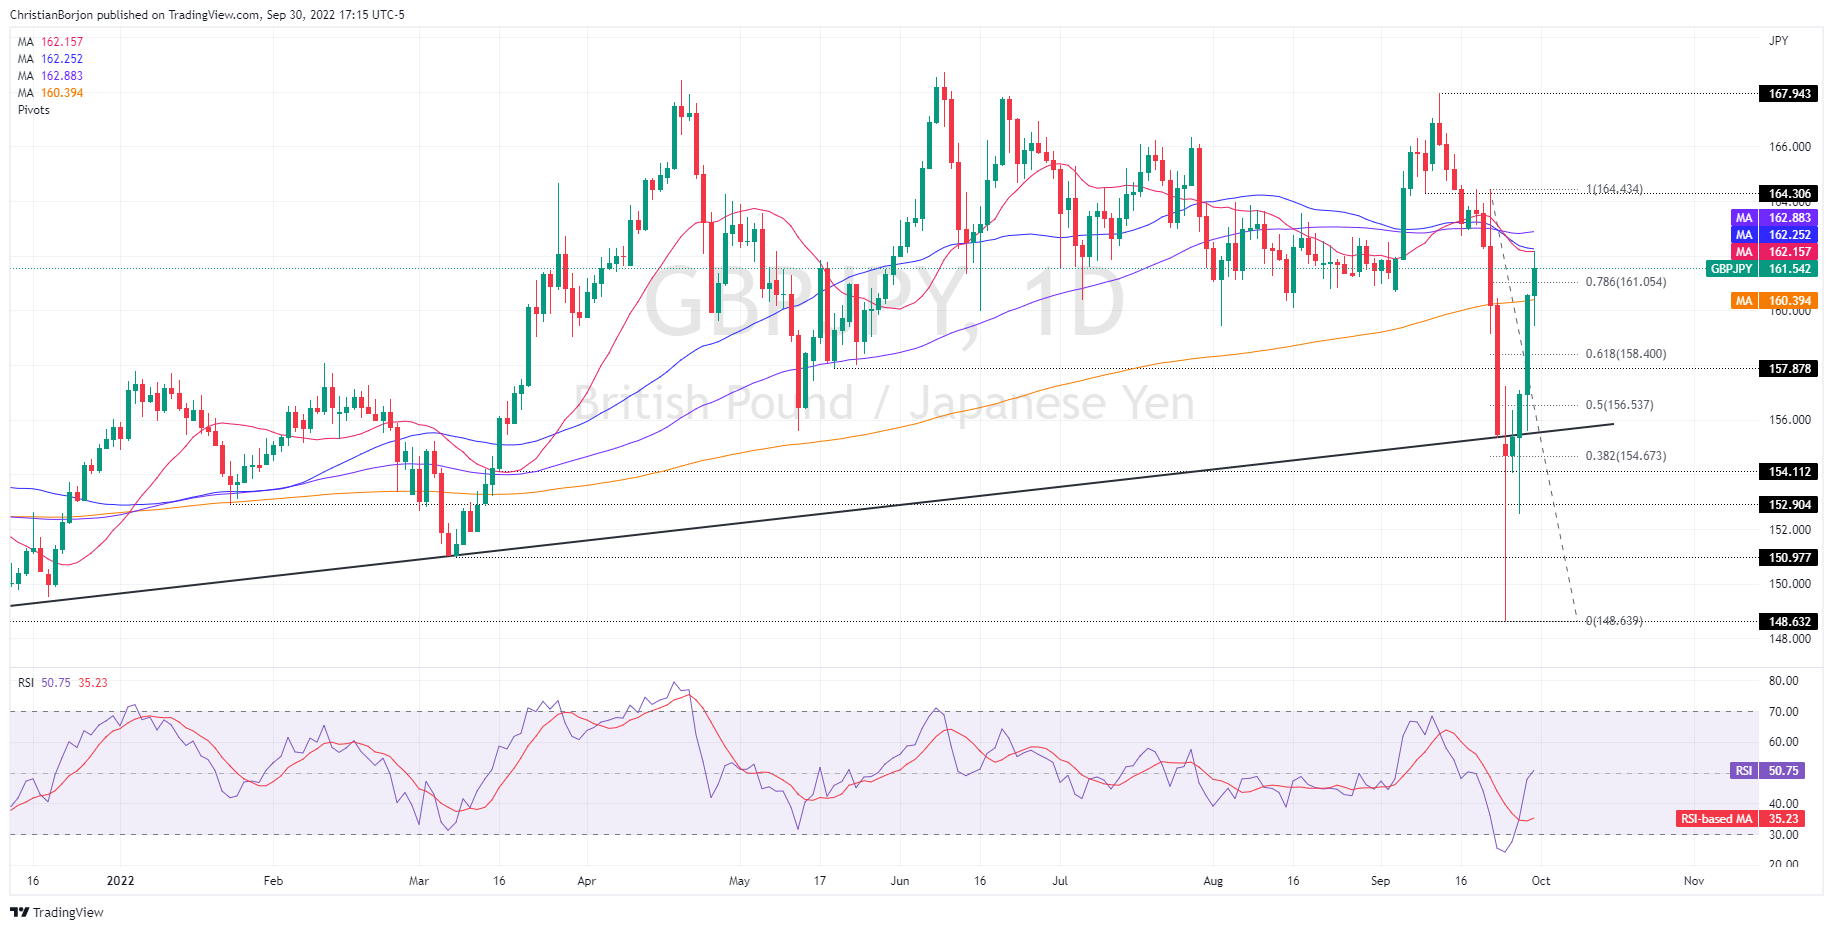
GBP/JPY Price Analysis: Technical outlook

From a weekly chart perspective, the GBP/JPY is neutral-to-upward biased after a volatile trading week that witnessed the pound sliding towards a YTD low of 148.63 before recovering close to 1200 pips. GBP/JPY traders should be aware of oscillators shifting to positive territory. Therefore, a re-test of the 20-week EMA, around 162.57, is on the cards.

The GBP/JPY daily chart shows that Friday’s rally was capped at a “packed” supply zone, with the 20, and the 50-day EMAs hoovering around 162.15-162.25, ahead of the 100-day EMA at 162.88. Worth noting that, albeit solid resistance lie above, the GBP/JPY pierced the 78.6% Fibonacci retracement at 161.05, opening the door for further upside.

Therefore, the GBP/JPY first resistance would be the 162.00 figure. Once cleared it would expose the aforementioned 162.15-162.25 area, followed by the 100-day EMA at 162.88 ahead of the 163.00 mark. A breach of the latter will expose the September 22 daily high at 164.43.

GBP/JPY Key Technical Levels

GBP/JPY

Overview
Today last price161.54
Today Daily Change1.04
Today Daily Change %0.65
Today daily open160.63
 
Trends
Daily SMA20162.19
Daily SMA50162.35
Daily SMA100162.92
Daily SMA200160.41
 
Levels
Previous Daily High160.65
Previous Daily Low155.61
Previous Weekly High164.45
Previous Weekly Low155.45
Previous Monthly High163.99
Previous Monthly Low159.45
Daily Fibonacci 38.2%158.73
Daily Fibonacci 61.8%157.54
Daily Pivot Point S1157.28
Daily Pivot Point S2153.92
Daily Pivot Point S3152.24
Daily Pivot Point R1162.31
Daily Pivot Point R2164
Daily Pivot Point R3167.35

Author

Christian Borjon Valencia

Christian Borjon began his career as a retail trader in 2010, mainly focused on technical analysis and strategies around it. He started as a swing trader, as he used to work in another industry unrelated to the financial markets.

More from Christian Borjon Valencia
Share:

Markets move fast. We move first.

Orange Juice Newsletter brings you expert driven insights - not headlines. Every day on your inbox.

By subscribing you agree to our Terms and conditions.

Editor's Picks

EUR/USD moves sideways below 1.1800 on Christmas Eve

EUR/USD struggles to find direction and trades in a narrow channel below 1.1800 after posting gains for two consecutive days. Bond and stock markets in the US will open at the usual time and close early on Christmas Eve, allowing the trading action to remain subdued. 

GBP/USD keeps range around 1.3500 amid quiet markets

GBP/USD keeps its range trade intact at around 1.3500 on Wednesday. The Pound Sterling holds the upper hand over the US Dollar amid pre-Christmas light trading as traders move to the sidelines heading into the holiday season. 

Gold retreats from record highs, trades below $4,500

Gold retreats after setting a new record-high above $4,520 earlier in the day and trades in a tight range below $4,500 as trading volumes thin out ahead of the Christmas break. The US Dollar selling bias remains unabated on the back of dovish Fed expectations, which continues to act as a tailwind for the bullion amid persistent geopolitical risks.

Bitcoin slips below $87,000 as ETF outflows intensify, whale participation declines

Bitcoin price continues to trade around $86,770 on Wednesday, after failing to break above the $90,000 resistance. US-listed spot ETFs record an outflow of $188.64 million on Tuesday, marking the fourth consecutive day of withdrawals.

Economic outlook 2026-2027 in advanced countries: Solidity test

After a year marked by global economic resilience and ending on a note of optimism, 2026 looks promising and could be a year of solid economic performance. In our baseline scenario, we expect most of the supportive factors at work in 2025 to continue to play a role in 2026.

Avalanche struggles near $12 as Grayscale files updated form for ETF

Avalanche trades close to $12 by press time on Wednesday, extending the nearly 2% drop from the previous day. Grayscale filed an updated form to convert its Avalanche-focused Trust into an ETF with the US Securities and Exchange Commission.