|

GBP/JPY Price Analysis: To extend its rally, as a dragonfly doji emerges around 160.50

  • Dragonfly doji surfaced as the GBP/JPY recovered from weekly lows around the mid-159/160 mark.
  • GBP/JPY Price Analysis: Neutral to downward biased, but in the short term, it could test the 200-DMA.

The GBP/JPY is almost unchanged as the Asian session kicks in, though Wednesday’s session witnessed the cross falling to new weekly lows of 159.50. However, the GBP/JPY pair staged a comeback and formed a dragonfly doji, which suggests bulls are moving in. The GBP/JPY is trading at 160.50 at the time of writing.

GBP/JPY Price Analysis: Technical outlook

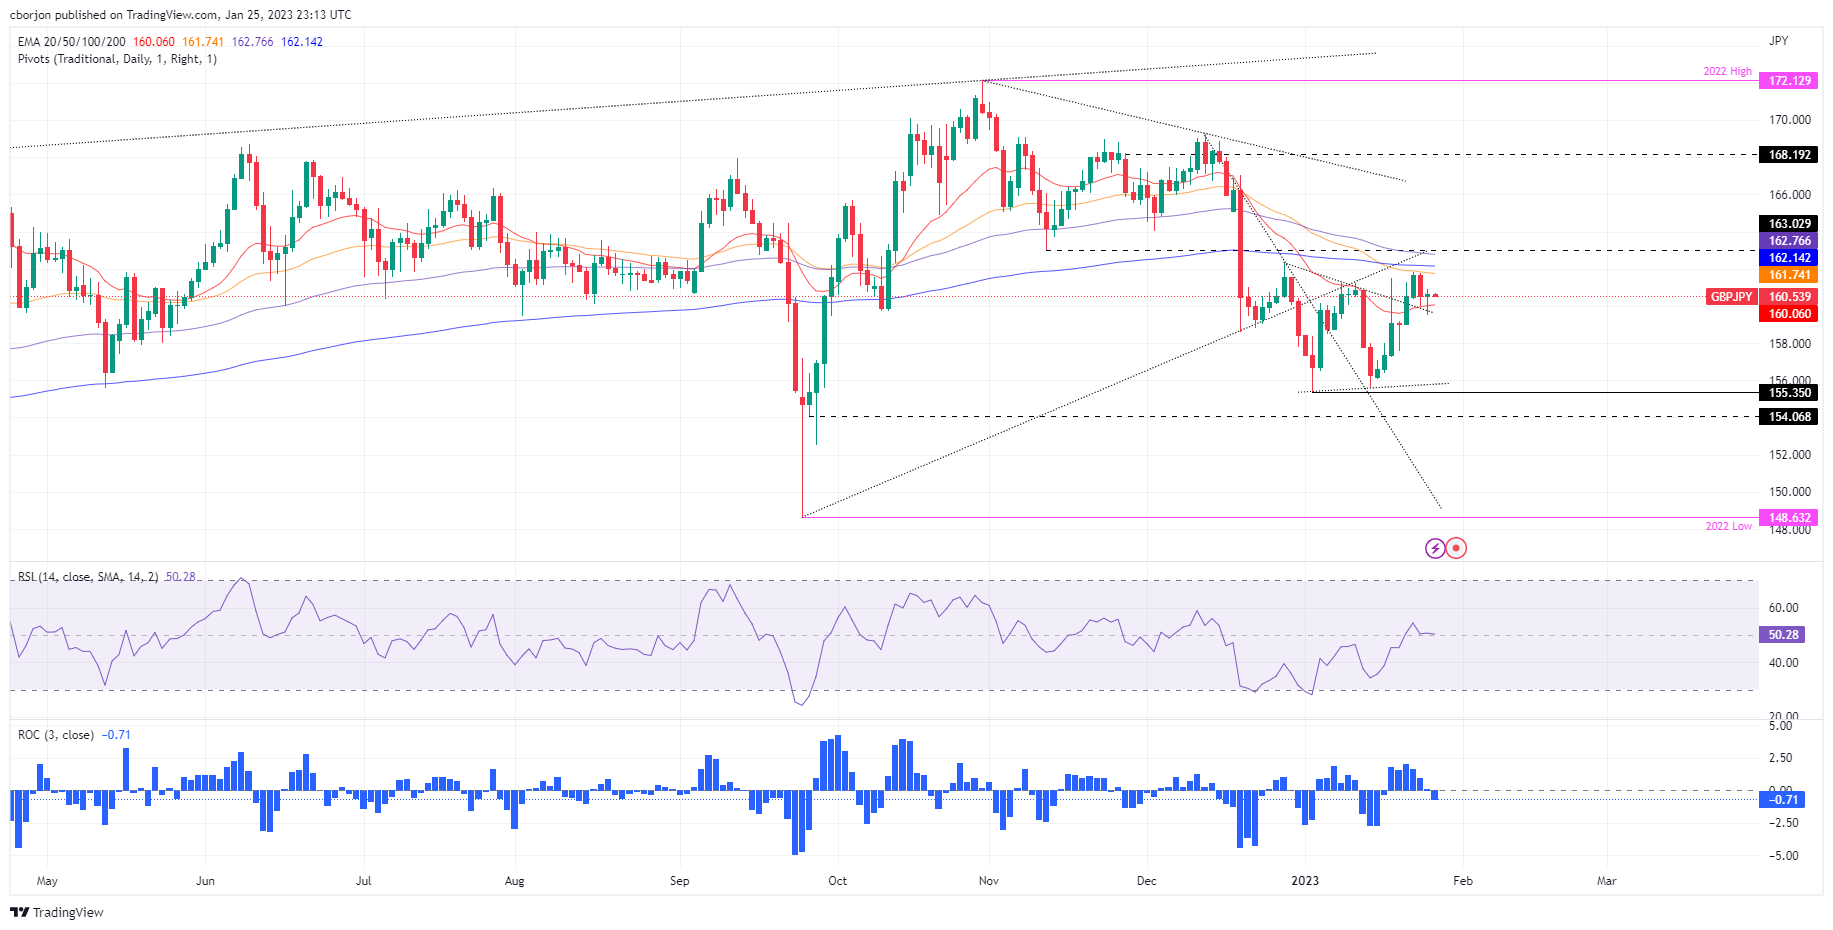
From a daily timeframe perspective, the GBP/JPY is still neutral-to-downward biased, with the exchange rate remaining below the trend-setter 200-day Exponential Moving Average (EMA) at 162.14, which is also above the 50-day EMA at 161.74. For the GBP/JPY to continue its downtrend, it would need to crack the 20-day EMA at 160.05, and then, the pair may pose a threat to break below the weekly low of 159.50.

As an alternate scenario, for the GBP/JPY bullish continuation, the pair needs to reclaim the psychological 161.00 figure. Break above will expose the 50-day EMA, followed by the 162.00 mark. Once broken, the bulls could challenge the 200-day EMA at 162.14.

GBP/JPY Key Technical Levels

GBP/JPY

Overview
Today last price160.61
Today Daily Change0.06
Today Daily Change %0.04
Today daily open160.55
 
Trends
Daily SMA20159.27
Daily SMA50163.07
Daily SMA100163.98
Daily SMA200163.46
 
Levels
Previous Daily High161.85
Previous Daily Low159.99
Previous Weekly High161.54
Previous Weekly Low156.06
Previous Monthly High169.28
Previous Monthly Low157.84
Daily Fibonacci 38.2%160.7
Daily Fibonacci 61.8%161.14
Daily Pivot Point S1159.75
Daily Pivot Point S2158.94
Daily Pivot Point S3157.89
Daily Pivot Point R1161.6
Daily Pivot Point R2162.65
Daily Pivot Point R3163.46

Author

Christian Borjon Valencia

Markets analyst, news editor, and trading instructor with over 14 years of experience across FX, commodities, US equity indices, and global macro markets.

More from Christian Borjon Valencia
Share:

Editor's Picks

EUR/USD keeps the offered stance just above 1.1700

EUR/USD is coming under heavy selling pressure in what has been a rather grim start to the new trading week, with the pair now trading close to the 1.1700 support area as the US Dollar stages a solid rebound. The prevailing flight to safety mood continues to favour the Greenback, as investors react to the escalating conflict in the Middle East and trim risk exposure across the board.

GBP/USD hits new yearly lows near 1.3300

GBP/USD adds to the recent bearish tone, approaching to the key 1.3300 support to reach fresh YTD troughs against the backdrop of the robust performance of the US Dollar. Indeed, Cable’s decline comes amid the firm demand for the safe-haven space in the wake of the US and Israel attacks to Iran.

Gold battles to retain the positive momentum

Gold now surrenders part of the earlier advance past the $5,400 mark per troy ounce at the beginning of the week. Indeed, the precious metal’s strong uptick remains fuelled by increasing geopolitical tensions in the Middle East amid the intense demand for safer assets.

Bitcoin on brink of breakdown amid US-Iran war

Bitcoin (BTC) remains under pressure near the key support level of $65,700. Trading at $66,400 at the time of writing on Monday, a breakdown below this critical level would suggest a deeper correction ahead.

The Fed is finally talking about AI – Here's why it matters for the US Dollar

AI is moving from earnings calls into the heart of monetary policy discussions, forcing Federal Reserve officials to confront a new question: How to act if AI reshapes inflation, employment and interest rates at the same time?

Grass 20% bullish breakout defies broader market weakness

Grass (GRASS) is edging up above $0.30 at the time of writing on Monday. The token’s notable 20% intraday surge stands out amid heightened volatility in the broader crypto market.