GBP/JPY Price Analysis: Surges 150 pips and records a fresh 7-year high at 168.53


  • The GBP/JPY is registering weekly gains of almost 3%.
  • Japanese yen weakness sounds the alarm of a possible intervention in the FX market.
  • GBP/JPY traders need to know how the USD/JPY behaves around 135.00.
  • GBP/JPY Price Forecast: Remains upward biased, and a break above 169.00 would open the door for 170.00; otherwise, a pullback towards 164.00s is on the cards.

The GBP/JPY soars to fresh six-year highs, despite a risk-off market mood, courtesy of the Bank of Japan’s (BoJ) pledging to keep its ultra-loose monetary policy posture, which also maintains the USD/JPY under pressure, reaching fresh 20-year highs. At the time of writing, the GBP/JPY is trading at 168.24, up almost 1%.

The Japanese yen would be under heavy pressure on Thursday. The USD/JPY is approaching the 135.00 mark, a price level mentioned by former Japanese officials as a line of the sand that could trigger an intervention by the Japanese Ministry of Finance in the Forex market.

Hiroshi Watanabe, a former currency chief in the Ministry of Finance until 2007, said that “Even 130, 135 is not so critically bad for the Japanese economy,” via Bloomberg. However, Watanabe added, “how long it’s going to stay there is quite important.”

In the meantime, Asian equity futures are mixed, carrying on Wall Street’s sentiment, with US stocks recording hefty losses.

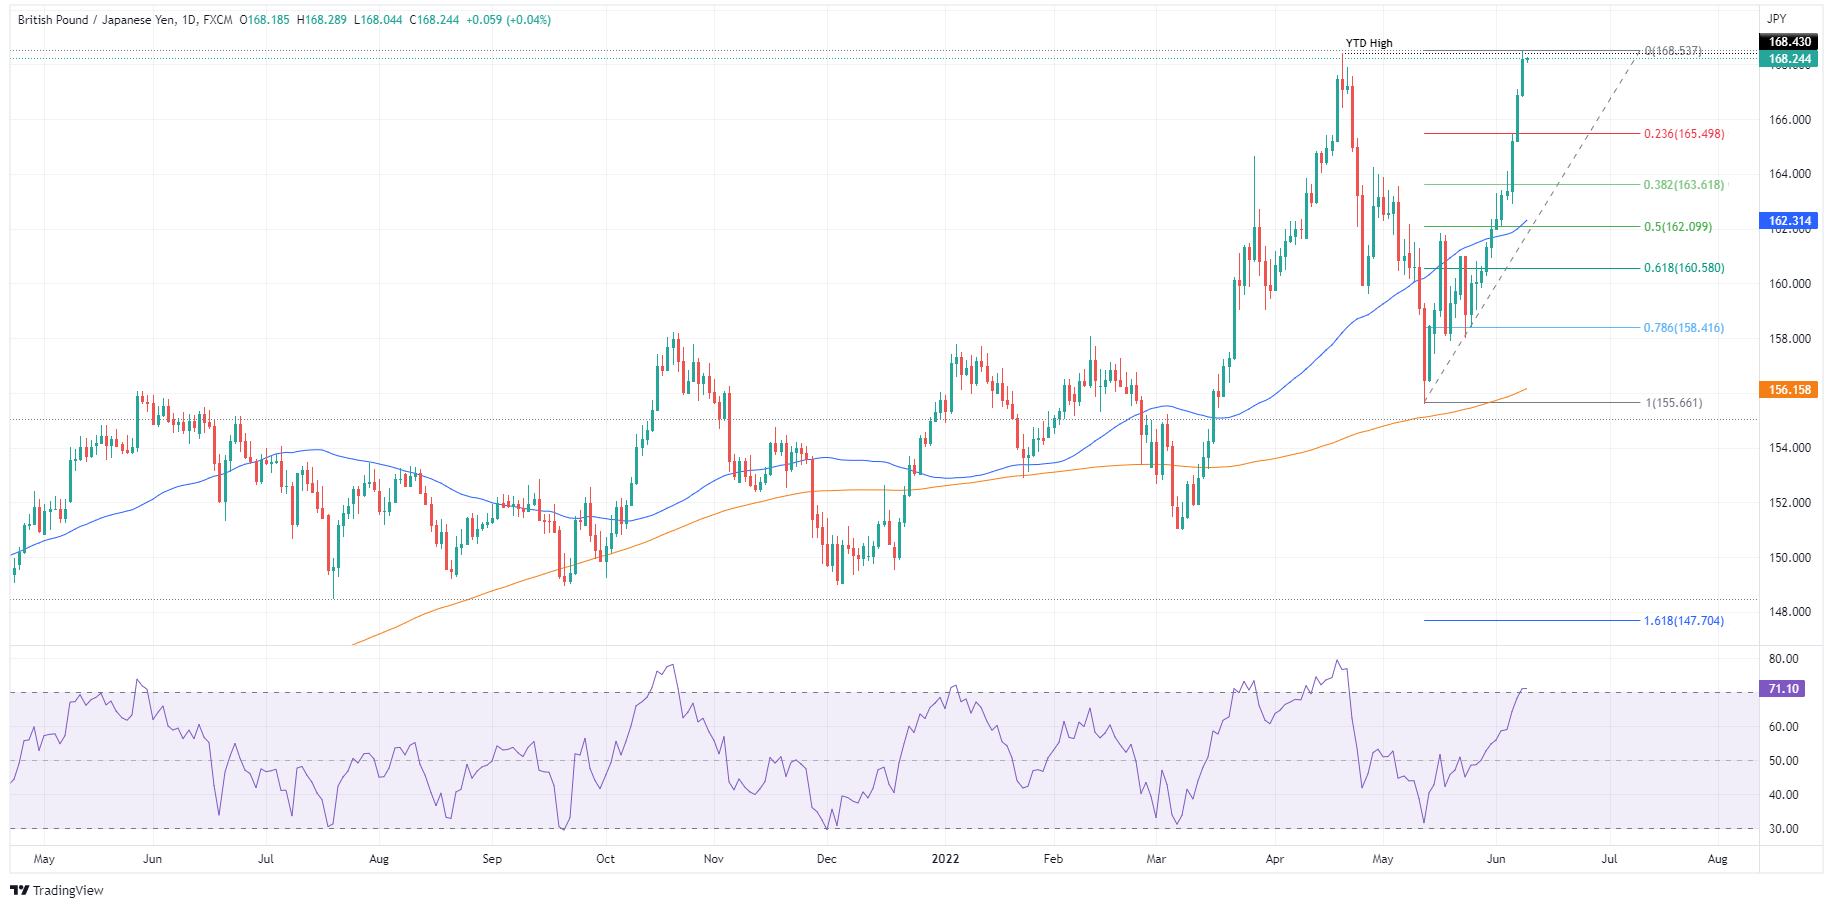
Meanwhile, GBP/JPY Wednesday’s price action opened around 166.80s, and rallied steadily towards 168.50s, recording minor pullbacks on its way up,

GBP/JPY Price Forecast: Technical outlook

The GBP/JPY had skyrocketed since May 25, when the cross soared 0.72%, beginning its 1024 pip rally towards printing a 7-year high above 168.50. It’s worth noting that the pair’s bias remains upward, but due to the steepness move of the cross and the Relative Strength Index (RSI) in overbought territory, it might pave the way for a pullback.

If the GBP/JPY heads for a pullback, the cross-currency first support would be June 8 daily low at 166.82. A breach of the latter would expose the 23.6% Fibonacci retracement at 165.49, followed by the 38.2% Fibonacci retracement at 163.62. On the other hand, if the GBP/JPY aims higher, the first resistance would be the 169.00 figure. A break above would expose February’s 2016 swing highs around 170.63. Once cleared, a GBP/JPYrally towards 175.01 is on the cards.

Key Technical Levels

GBP/JPY

Overview
Today last price 168.24
Today Daily Change 1.36
Today Daily Change % 0.81
Today daily open 166.96
 
Trends
Daily SMA20 160.89
Daily SMA50 162.04
Daily SMA100 158.86
Daily SMA200 156.06
 
Levels
Previous Daily High 167.11
Previous Daily Low 165.24
Previous Weekly High 164.11
Previous Weekly Low 160.48
Previous Monthly High 163.91
Previous Monthly Low 155.6
Daily Fibonacci 38.2% 166.4
Daily Fibonacci 61.8% 165.96
Daily Pivot Point S1 165.77
Daily Pivot Point S2 164.57
Daily Pivot Point S3 163.9
Daily Pivot Point R1 167.64
Daily Pivot Point R2 168.31
Daily Pivot Point R3 169.5


Share: Feed news

Information on these pages contains forward-looking statements that involve risks and uncertainties. Markets and instruments profiled on this page are for informational purposes only and should not in any way come across as a recommendation to buy or sell in these assets. You should do your own thorough research before making any investment decisions. FXStreet does not in any way guarantee that this information is free from mistakes, errors, or material misstatements. It also does not guarantee that this information is of a timely nature. Investing in Open Markets involves a great deal of risk, including the loss of all or a portion of your investment, as well as emotional distress. All risks, losses and costs associated with investing, including total loss of principal, are your responsibility. The views and opinions expressed in this article are those of the authors and do not necessarily reflect the official policy or position of FXStreet nor its advertisers. The author will not be held responsible for information that is found at the end of links posted on this page.

If not otherwise explicitly mentioned in the body of the article, at the time of writing, the author has no position in any stock mentioned in this article and no business relationship with any company mentioned. The author has not received compensation for writing this article, other than from FXStreet.

FXStreet and the author do not provide personalized recommendations. The author makes no representations as to the accuracy, completeness, or suitability of this information. FXStreet and the author will not be liable for any errors, omissions or any losses, injuries or damages arising from this information and its display or use. Errors and omissions excepted.

The author and FXStreet are not registered investment advisors and nothing in this article is intended to be investment advice.

Recommended content


Recommended content

Editors’ Picks

AUD/USD could extend the recovery to 0.6500 and above

AUD/USD could extend the recovery to 0.6500 and above

The enhanced risk appetite and the weakening of the Greenback enabled AUD/USD to build on the promising start to the week and trade closer to the key barrier at 0.6500 the figure ahead of key inflation figures in Australia.

AUD/USD News

EUR/USD now refocuses on the 200-day SMA

EUR/USD now refocuses on the 200-day SMA

EUR/USD extended its positive momentum and rose above the 1.0700 yardstick, driven by the intense PMI-led retracement in the US Dollar as well as a prevailing risk-friendly environment in the FX universe.

EUR/USD News

Gold struggles around $2,325 despite broad US Dollar’s weakness

Gold struggles around $2,325 despite broad US Dollar’s weakness

Gold reversed its direction and rose to the $2,320 area, erasing a large portion of its daily losses in the process. The benchmark 10-year US Treasury bond yield stays in the red below 4.6% following the weak US PMI data and supports XAU/USD.

Gold News

Bitcoin price makes run for previous cycle highs as Morgan Stanley pushes BTC ETF exposure

Bitcoin price makes run for previous cycle highs as Morgan Stanley pushes BTC ETF exposure

Bitcoin (BTC) price strength continues to grow, three days after the fourth halving. Optimism continues to abound in the market as Bitcoiners envision a reclamation of previous cycle highs.

Read more

US versus the Eurozone: Inflation divergence causes monetary desynchronization

US versus the Eurozone: Inflation divergence causes monetary desynchronization

Historically there is a very close correlation between changes in US Treasury yields and German Bund yields. This is relevant at the current juncture, considering that the recent hawkish twist in the tone of the Federal Reserve might continue to push US long-term interest rates higher and put upward pressure on bond yields in the Eurozone. 

Read more

Forex MAJORS

Cryptocurrencies

Signatures