|

GBP/JPY Price Analysis: Snaps six days of gains, drops below 168.00

  • GBP/JPY hit a two-week high but trimmed some gains, back below 168.00.
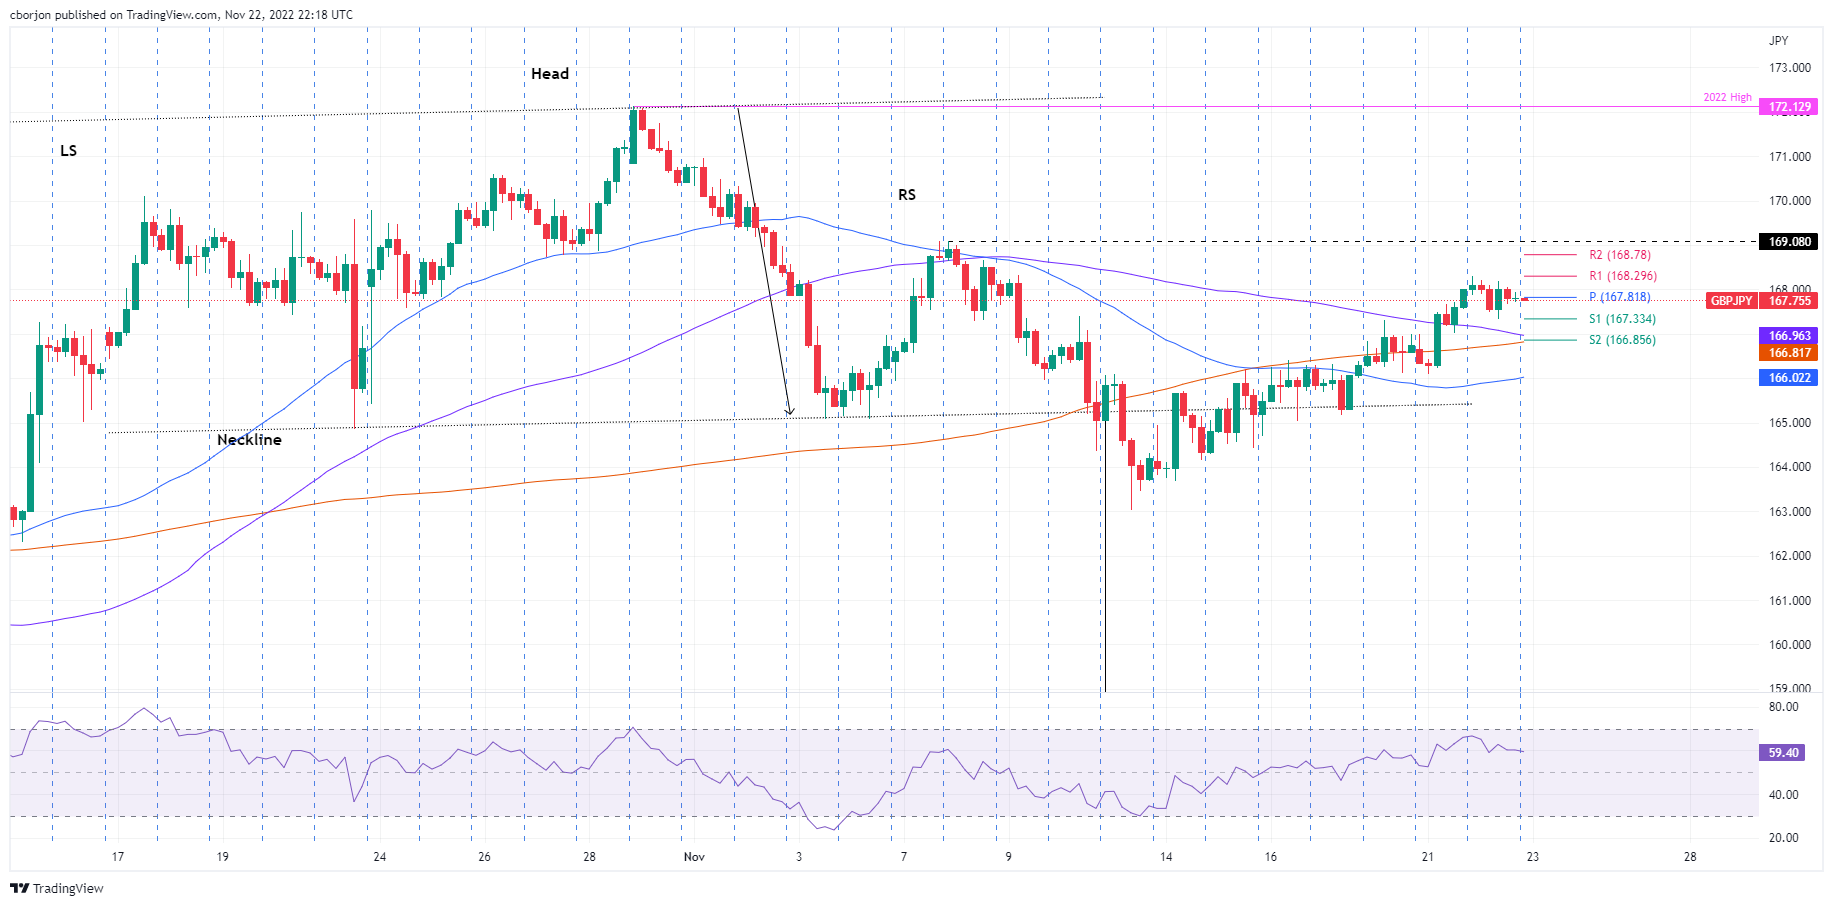
  • The daily chart suggests the GBP/JPY is neutral-upward biased, but a head-and-shoulders pattern remains in play.
  • GBP/JPY Price Analysis: Failure to crack 168.00 exacerbated a fall toward 167.50.

On Tuesday, the GBP/JPY retraces after hitting a two-week high around 168.30, amid upbeat sentiment, as shown by Wall Street, registering gains between 1.18% and 1.36%. However, the head-and-shoulders chart pattern remains in play as long as the right shoulder, around 169.08, is not surpassed. That said, the GBP/JPY is trading at 167.75, below its opening price by 0.46%.

GBP/JPY Price Analysis: Technical outlook

In the long term, the GBP/JPY remains neutral to upward biased, though a head-and-shoulders pattern emerging in the daily chart opened the door for a fall to 158.40. However, during the last week, the cross-registered gains of 2%, exchanging hands 300 pips above the neckline. If British Pound (GBP) buyers reclaim 169.00, that would invalidate the pattern and might exacerbate a rally toward the YTD highs of 172.13.

Short term, the GBP/JPY 4-hour chart illustrates the pair as neutral, slightly upward biased. GBP/JPY price action registered successive series of higher highs/lows, advancing steadily from around 163.03. On its way north, the GBP/JPY hurdled the 50, 200, and 100-Exponential Moving Averages (EMAs), suggesting buyers gathered momentum. But the Relative Strength Index (RSI), aiming downwards, could open the door for a pullback.

Therefore, the GBP/JPY first support would be the S1 daily pivot point at 167.33. Break below will expose the confluence of the 100 and the 200-EMAs around 166.81/93, followed by the 50-EMA at 166.02. Otherwise, the GBP/JPY key resistance levels lie at the R1 daily pivot at 168.29, followed b the R2 pivot level at 168.78, followed by the November 7 daily high at 169.00.

GBP/JPY Key Technical Levels

GBP/JPY

Overview
Today last price167.89
Today Daily Change-0.05
Today Daily Change %-0.03
Today daily open167.94
 
Trends
Daily SMA20167.55
Daily SMA50164.96
Daily SMA100164.04
Daily SMA200162.4
 
Levels
Previous Daily High168
Previous Daily Low166.11
Previous Weekly High167.32
Previous Weekly Low163.7
Previous Monthly High172.14
Previous Monthly Low159.73
Daily Fibonacci 38.2%167.28
Daily Fibonacci 61.8%166.83
Daily Pivot Point S1166.7
Daily Pivot Point S2165.45
Daily Pivot Point S3164.8
Daily Pivot Point R1168.59
Daily Pivot Point R2169.25
Daily Pivot Point R3170.49

Author

Christian Borjon Valencia

Markets analyst, news editor, and trading instructor with over 14 years of experience across FX, commodities, US equity indices, and global macro markets.

More from Christian Borjon Valencia
Share:

Editor's Picks

EUR/USD: Breakdown below trading range support near 1.1770 comes into play

The EUR/USD pair opens with a bearish gap at the start of a new week as the US-Iran war-led global flight to safety boosts the US Dollar. Spot prices, however, lack follow-through selling and manage to hold above mid-1.1700s during the Asian session.

GBP/USD targets 1.3500 barrier near moving averages

GBP/USD rebounds from the daily losses, trading around 1.3450 during the Asian hours on Monday. The technical analysis of the daily chart indicates an ongoing bearish bias, as the pair trades within a descending channel pattern.

Gold looks further north as Iran war boosts haven demand

Gold is taking a breather after the initial run to over one-month highs near $5,400, kicking off the new week with a bang. A global flight to safety theme, following the US-Israel joint attacks on Iran over the weekend, bolstered the demand for the traditional store of value, Gold.

Top Crypto Losers: Tezos, Toncoin, and Polkadot at crucial levels amid US-Israel strike on Iran

Altcoins such as Tezos, Toncoin, and Polkadot rank among the worst hit cryptocurrencies over the last 24 hours amid the US and Israel's attack on Iran. Tezos and Toncoin are down to crucial support levels while Polkadot remains near a crucial resistance trendline, showcasing underlying strength.

The market is paying for insurance, not apocalypse

As expected, this morning felt less like a Monday market open and more like a fire drill. Futures screens flickered red. S&P contracts down almost 1%. Nasdaq off 1.2%. Brent leaped 13% through $80. Gold rose 1.6% toward $5350 before paring some gains. The dollar is strutting mildly. The Swiss franc is quietly doing what it always does in a storm, catching some safe-haven flows.

Starknet unveils strkBTC, shielded Bitcoin transactions on Ethereum Layer 2

Starknet, the Ethereum Layer 2 network developed by StarkWare, today announced strkBTC, a wrapped Bitcoin asset that introduces optional shielding while preserving full DeFi composability.