|

GBP/JPY Price Analysis: Shifted bearish after plunging below the 200-EMA

  • In the overnight session, the GBP/JPY tumbled near 4.50% on concerns over the UK budget.
  • The GBP/JPY pierced the 20 and 50-Week EMAs, hoovering around the 100-Week EMA.
  • GBP/JPY Price Analysis: Shifted bearish biased, as it broke below the 200-EMA, eyeing a re-test of the YTD low around 148.00.

The GBP/JPY drops as the New York session is about to finish, though recovered after printing a fresh one-year low at around 148.63, on Increasing concerns that the UK’s new budget would likely add to the country’s inflationary pressures amidst the Bank of England’s tightening cycle to quell inflation from double-digit levels. At the time of writing, the GBP/JPY is trading at 154.56, still below its opening price.

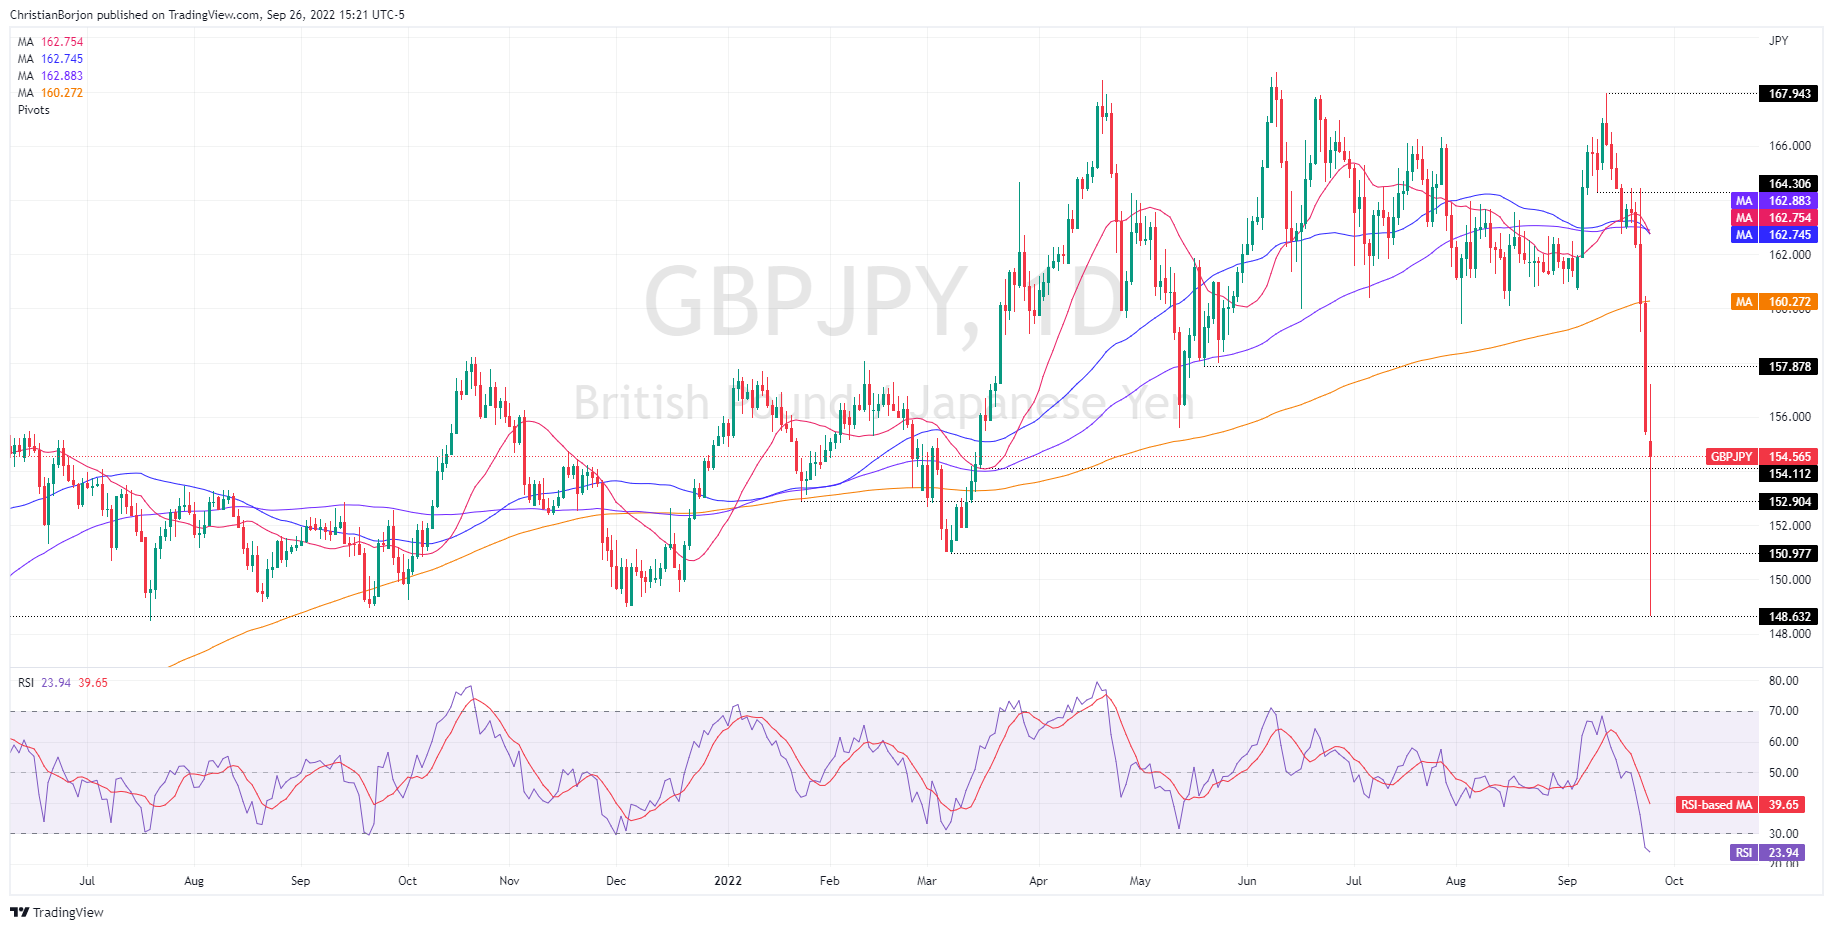
GBP/JPY Price Analysis: Technical outlook

The GBP/JPY weekly chart portrays the cross tumbled below the 20, 50, and 100-Week EMAs, though the pair trimmed some of its losses and is back above the 154.80 mark. Oscillators, mainly the Relative Strength Index (RSI), shifted negatively, showing the Japanese FX intervention’s impact alongside the UK’s slowing economic outlook. If the GBP/JPY registers a decisive break below the 100-WEMA at 153.52, that could pave the way for further losses. Otherwise, expect the cross-currency to stay range-bound in the 153.50-158.56 range.

From a daily chart perspective, the GBP/JPY shifted bearish biased once sellers hurdled the 200-day EMA, which, at the time of typing, stands at 160.27, opening the door for further losses. GBP/JPY traders should be aware that the Relative Strength Index (RSI) plunged to oversold levels at 24, which could impede sellers from taking action. Indeed, once the RSI exits from those levels, traders should expect a resumption of the downtrend, targeting the fresh YTD low at 148.53, which could extend towards the September 2020 cycle high of 142.70.

GBP/JPY Key Technical Levels

GBP/JPY

Overview
Today last price154.55
Today Daily Change-1.09
Today Daily Change %-0.70
Today daily open155.64
 
Trends
Daily SMA20163.18
Daily SMA50163.02
Daily SMA100163.01
Daily SMA200160.31
 
Levels
Previous Daily High160.47
Previous Daily Low155.45
Previous Weekly High164.45
Previous Weekly Low155.45
Previous Monthly High163.99
Previous Monthly Low159.45
Daily Fibonacci 38.2%157.37
Daily Fibonacci 61.8%158.55
Daily Pivot Point S1153.9
Daily Pivot Point S2152.17
Daily Pivot Point S3148.89
Daily Pivot Point R1158.92
Daily Pivot Point R2162.2
Daily Pivot Point R3163.93

Author

Christian Borjon Valencia

Christian Borjon began his career as a retail trader in 2010, mainly focused on technical analysis and strategies around it. He started as a swing trader, as he used to work in another industry unrelated to the financial markets.

More from Christian Borjon Valencia
Share:

Markets move fast. We move first.

Orange Juice Newsletter brings you expert driven insights - not headlines. Every day on your inbox.

By subscribing you agree to our Terms and conditions.

Editor's Picks

EUR/USD moves sideways below 1.1800 on Christmas Eve

EUR/USD struggles to find direction and trades in a narrow channel below 1.1800 after posting gains for two consecutive days. Bond and stock markets in the US will open at the usual time and close early on Christmas Eve, allowing the trading action to remain subdued. 

GBP/USD keeps range around 1.3500 amid quiet markets

GBP/USD keeps its range trade intact at around 1.3500 on Wednesday. The Pound Sterling holds the upper hand over the US Dollar amid pre-Christmas light trading as traders move to the sidelines heading into the holiday season. 

Gold retreats from record highs, trades below $4,500

Gold retreats after setting a new record-high above $4,520 earlier in the day and trades in a tight range below $4,500 as trading volumes thin out ahead of the Christmas break. The US Dollar selling bias remains unabated on the back of dovish Fed expectations, which continues to act as a tailwind for the bullion amid persistent geopolitical risks.

Bitcoin slips below $87,000 as ETF outflows intensify, whale participation declines

Bitcoin price continues to trade around $86,770 on Wednesday, after failing to break above the $90,000 resistance. US-listed spot ETFs record an outflow of $188.64 million on Tuesday, marking the fourth consecutive day of withdrawals.

Economic outlook 2026-2027 in advanced countries: Solidity test

After a year marked by global economic resilience and ending on a note of optimism, 2026 looks promising and could be a year of solid economic performance. In our baseline scenario, we expect most of the supportive factors at work in 2025 to continue to play a role in 2026.

Avalanche struggles near $12 as Grayscale files updated form for ETF

Avalanche trades close to $12 by press time on Wednesday, extending the nearly 2% drop from the previous day. Grayscale filed an updated form to convert its Avalanche-focused Trust into an ETF with the US Securities and Exchange Commission.