|
GBP/JPY Price Analysis: Retreats from 14-month highs

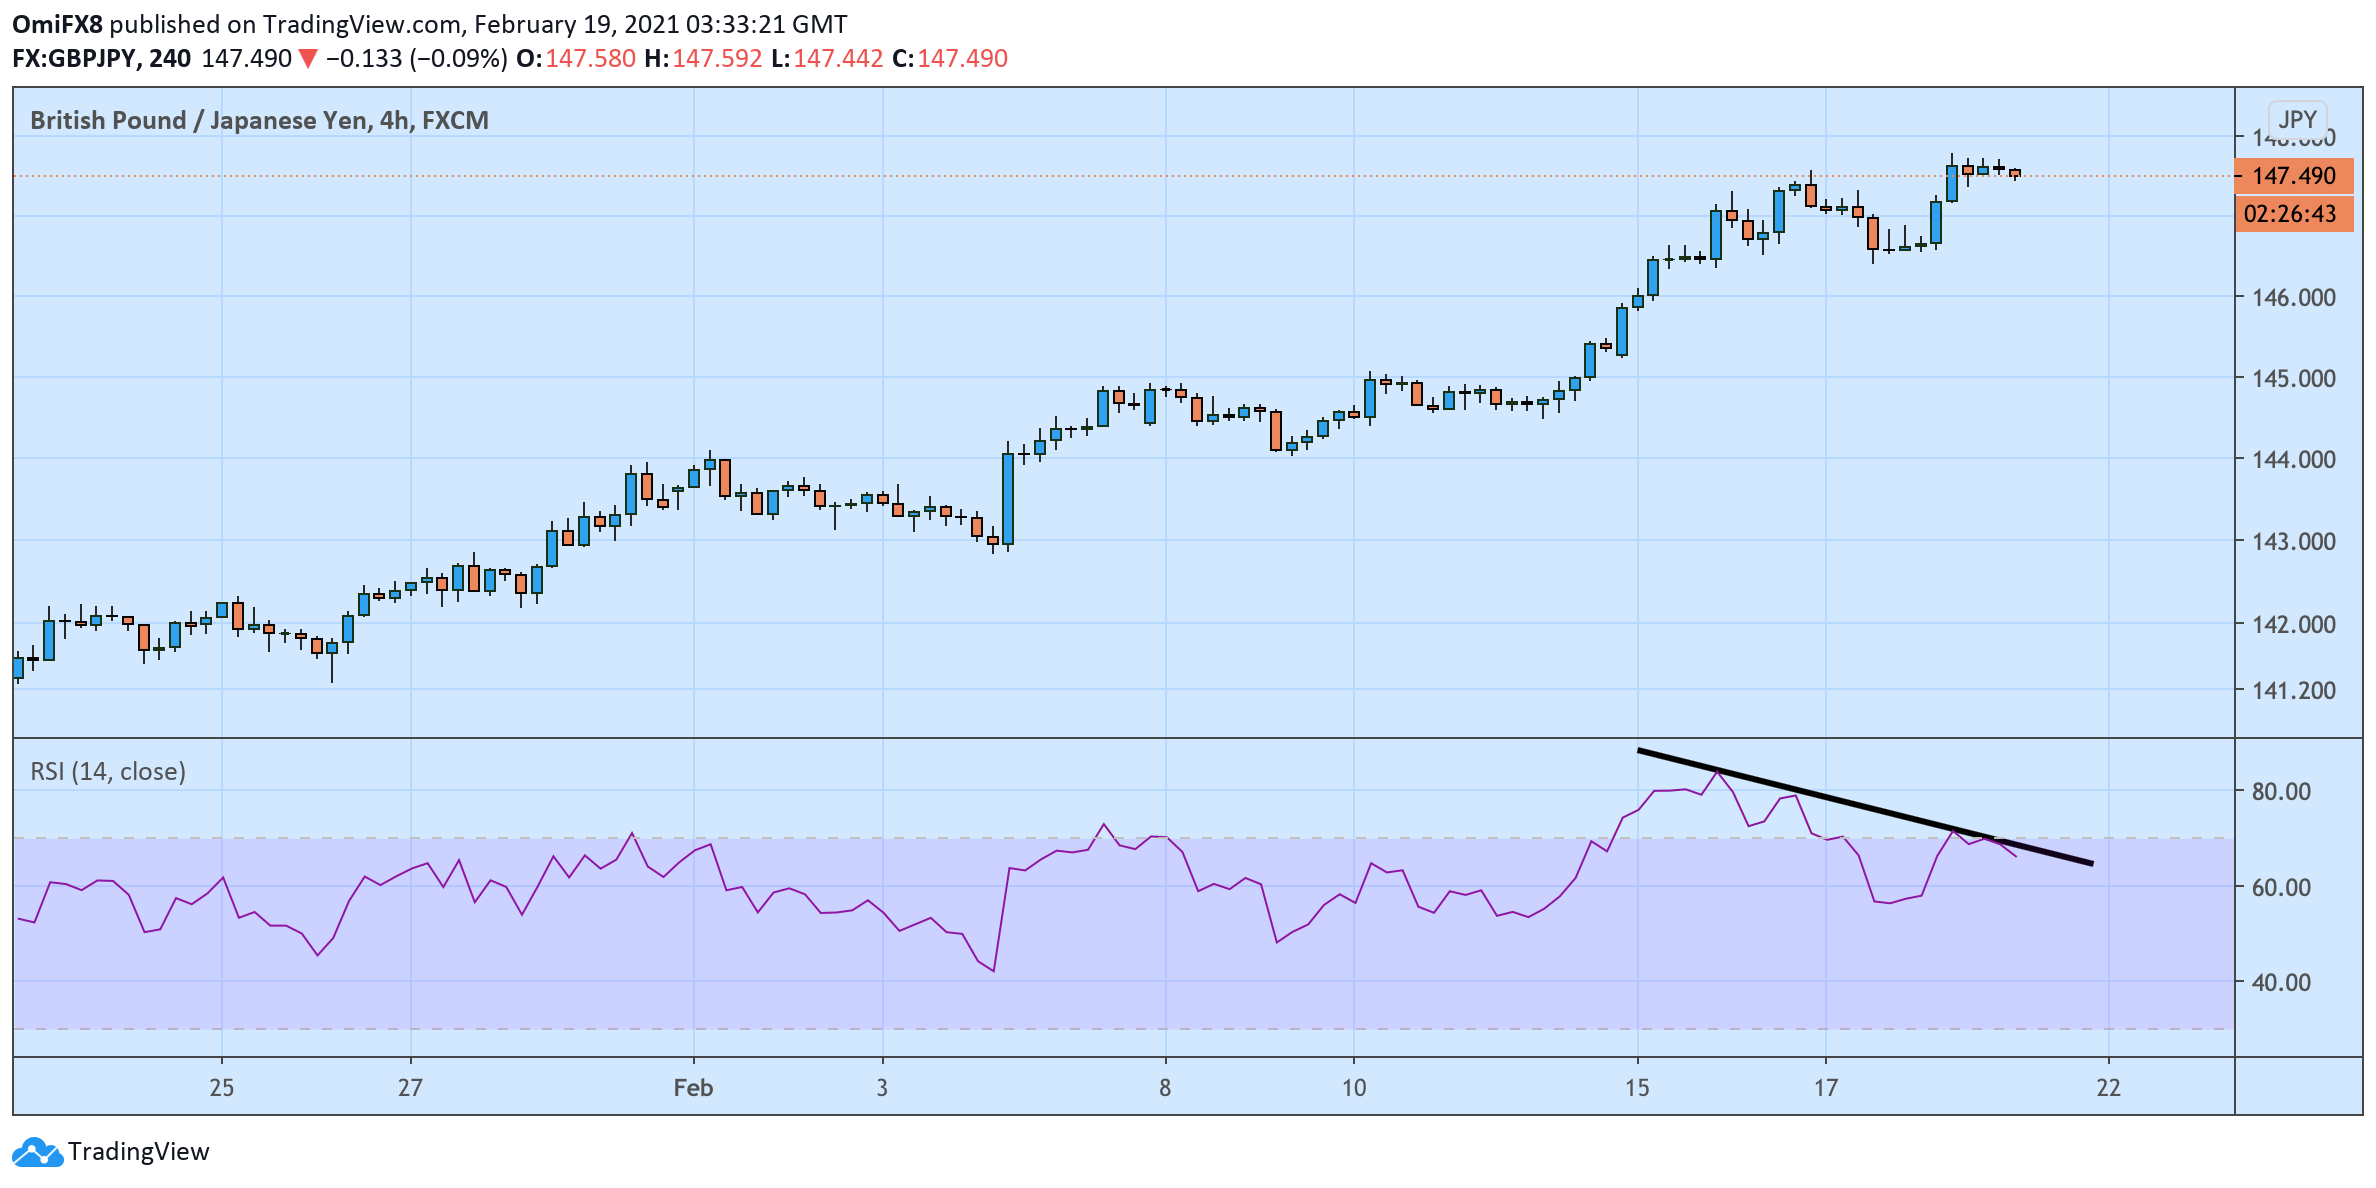
GBP/JPY is trading near 147.47 at press time, having printed a high of 147.71 on Thursday. That level was last seen in December 2019.
The pullback could be extended further, as the 4-hour chart shows a bearish divergence of the Relative Strength Index, a sign of weakening of upward momentum.
Support is seen at 147.11 (50-hour Simple Moving Average). Meanwhile, Thursday's high of 147.71 is the level to beat for the bulls. A violation there would expose 147.95 (December 2017 high(.
4-hour chart
Trend: Pullback likely
Technical levels
Author

Omkar Godbole
FXStreet Contributor
Omkar Godbole, editor and analyst, joined FXStreet after four years as a research analyst at several Indian brokerage companies.
More from Omkar Godbole


