GBP/JPY Price Analysis: Remains on the defensive around 185.20 ahead of UK Retail Sales


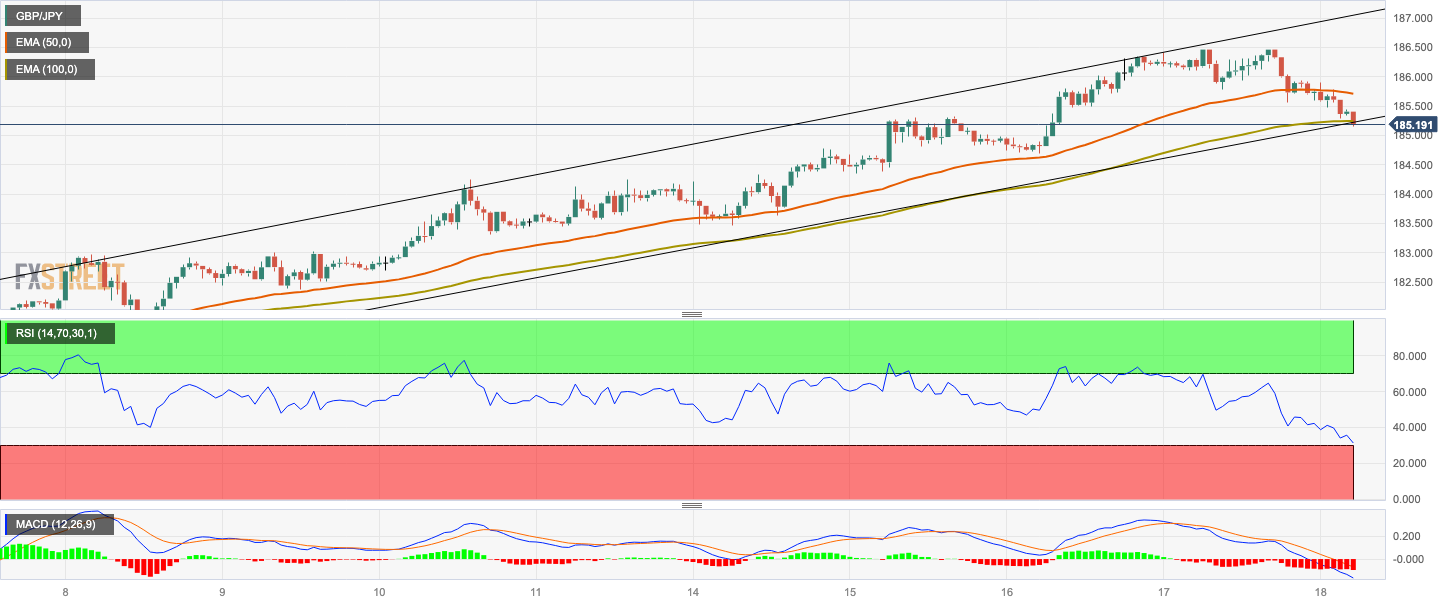
  • GBP/JPY cross trades within an ascending trend-channel on the one-hour chart.
  • The next support level is located at 184.35; the first resistance level is seen at 185.70.
  • The Relative Strength Index (RSI) and MACD stand in bearish territory.

The GBP/JPY cross remains under pressure for the second consecutive day heading into the early European session on Friday. Market turn cautious amid the fear of China’s debt crisis and real-estate woes, which boost the Japanese Yen, a traditional safe-haven currency. However, the release of the UK Retail Sales could provide a clear direction for the cross. 

On Thursday, Evergrande, China’s second-largest real estate company filed for bankruptcy in a US court under Chapter 15. This report fuels the fear of a potential Chinese property catastrophe. Furthermore, Fitch Ratings revealed on the same day that they might reconsider China's A+ sovereign credit rating in the face of intensifying economic headwinds. This, in turn, exerts pressure on the Pound Sterling and acts as a headwind for GBP/JPY. 

From the technical perspective, the GBP/JPY cross trades within an ascending trend-channel since August 4 on the one-hour chart. The cross stands below the 50- and 100-hour Exponential Moving Averages (EMAs) with a downward slope, which means the path of the least resistance is to the downside.

That said, a decisive break below 185.20 (the lower limit of the ascending trend-channel and 100-hour EMA) will see a drop to 184.70 (low of August 16). The next contention is located at 184.35 (high of August 14). The additional downside filter to watch is the 184.00–184.10 region, representing a psychological round figure. The key support level is located at 183.00, portraying a confluence of a high of August 8 and the round mark.

On the upside, GBP/JPY’s immediate resistance level is seen at 185.70 (50-hour EMA). Any meaningful follow-through buying will see the next stop at 186.35 (a weekly high of December 4, 2015). The critical barrier is seen at 187.00 (a round figure and a weekly high of November 27, 2015).

It’s worth noting that the Relative Strength Index (RSI) is located below 50, while the Moving Average Convergence/Divergence (MACD) stand in bearish territory. Both momentum indicators highlight that further downside cannot be ruled out.

GBP/JPY one-hour chart


GBP/JPY

Overview
Today last price 185.22
Today Daily Change -0.67
Today Daily Change % -0.36
Today daily open 185.89
 
Trends
Daily SMA20 182.69
Daily SMA50 181.78
Daily SMA100 175.59
Daily SMA200 168.97
 
Levels
Previous Daily High 186.47
Previous Daily Low 185.57
Previous Weekly High 184.25
Previous Weekly Low 180.58
Previous Monthly High 184.02
Previous Monthly Low 176.32
Daily Fibonacci 38.2% 185.91
Daily Fibonacci 61.8% 186.13
Daily Pivot Point S1 185.48
Daily Pivot Point S2 185.07
Daily Pivot Point S3 184.58
Daily Pivot Point R1 186.39
Daily Pivot Point R2 186.88
Daily Pivot Point R3 187.29


Share: Feed news

Information on these pages contains forward-looking statements that involve risks and uncertainties. Markets and instruments profiled on this page are for informational purposes only and should not in any way come across as a recommendation to buy or sell in these assets. You should do your own thorough research before making any investment decisions. FXStreet does not in any way guarantee that this information is free from mistakes, errors, or material misstatements. It also does not guarantee that this information is of a timely nature. Investing in Open Markets involves a great deal of risk, including the loss of all or a portion of your investment, as well as emotional distress. All risks, losses and costs associated with investing, including total loss of principal, are your responsibility. The views and opinions expressed in this article are those of the authors and do not necessarily reflect the official policy or position of FXStreet nor its advertisers. The author will not be held responsible for information that is found at the end of links posted on this page.

If not otherwise explicitly mentioned in the body of the article, at the time of writing, the author has no position in any stock mentioned in this article and no business relationship with any company mentioned. The author has not received compensation for writing this article, other than from FXStreet.

FXStreet and the author do not provide personalized recommendations. The author makes no representations as to the accuracy, completeness, or suitability of this information. FXStreet and the author will not be liable for any errors, omissions or any losses, injuries or damages arising from this information and its display or use. Errors and omissions excepted.

The author and FXStreet are not registered investment advisors and nothing in this article is intended to be investment advice.

Recommended content


Recommended content

Editors’ Picks

AUD/USD depreciates amid mixed Chinese data, stronger US Dollar

AUD/USD depreciates amid mixed Chinese data, stronger US Dollar

The AUD/USD continues to decline for the second consecutive session, trading around 0.6660. This is largely influenced by recent mixed economic data from China released on Friday. The Aussie dollar had already been under pressure after Australia's employment figures were released on Thursday, which presented a mixed picture.

AUD/USD News

EUR/USD slipped on Thursday after Greenback pares some losses

EUR/USD slipped on Thursday after Greenback pares some losses

EUR/USD eased slightly on Thursday, falling back below 1.0880 as the Greenback broadly recovers losses from earlier in the week. The pair remains up for the trading week, but a late break for the US Dollar is on the cards as investors second-guess the Fed's stance on rate cuts.

EUR/USD News

Gold price loses momentum, with Fed speakers in focus

Gold price loses momentum, with Fed speakers in focus

Gold price trades with a bearish bias on Friday after retreating from the nearly $2,400 barrier. The bullish move of precious metals in the previous sessions was bolstered by the softer-than-expected US inflation data in April, which triggered hope for rate cuts from the US Federal Reserve.

Gold News

LINK price jumps 10% as Chainlink races toward tokenization of funds

LINK price jumps 10% as Chainlink races toward tokenization of funds

Chainlink price has remained range-bound for a while, stuck between the $16.00 roadblock to the upside and $13.08 to the downside. However, in light of recent revelations, the token may have further upside potential.

Read more

April CPI: Worst good news ever

April CPI: Worst good news ever

The monthly rise in prices based on the Consumer Price Index (CPI) came in slightly lower than projected, sending a wave of euphoria across the financial landscape. The consensus is cooling inflation puts Federal Reserve interest rate cuts back on the table.

Read more

Forex MAJORS

Cryptocurrencies

Signatures