|

GBP/JPY Price Analysis: Refreshes weekly high above 182.00

  • GBP/JPY rises swiftly above 182.00 amid uncertainty over timeframe of BoJ’s exit to loose policy.
  • The UK Composite and Services PMI are seen remaining unchanged.
  • Advancing 20-EMA indicates strength in the bullish bias.

The GBP/JPY pair prints a fresh weekly high slightly above 182.00 as investors capitalize on risk-on mood. The cross advanced on Thursday amid hopes that the Bank of England (BoE) will begin reducing interest rates later than other Group of Seven economies.

On the economic data front, investors await the United Kingdom’s S&P Global Composite and Services PMI for December, which will be published at 09:30 GMT. As per the estimates, the Composite and Services PMI will remain unchanged at 51.7 and 52.7 respectively.

The Japanese Yen struggles for a firm footing as investors are uncertain about the time-period when the Bank of Japan (BoJ) will exit from the ultra-loose monetary policy stance. BoJ Governor Kazuo Ueda needs to confirm that wage growth should be sufficient to keep the underlying inflation steadily above 2%.

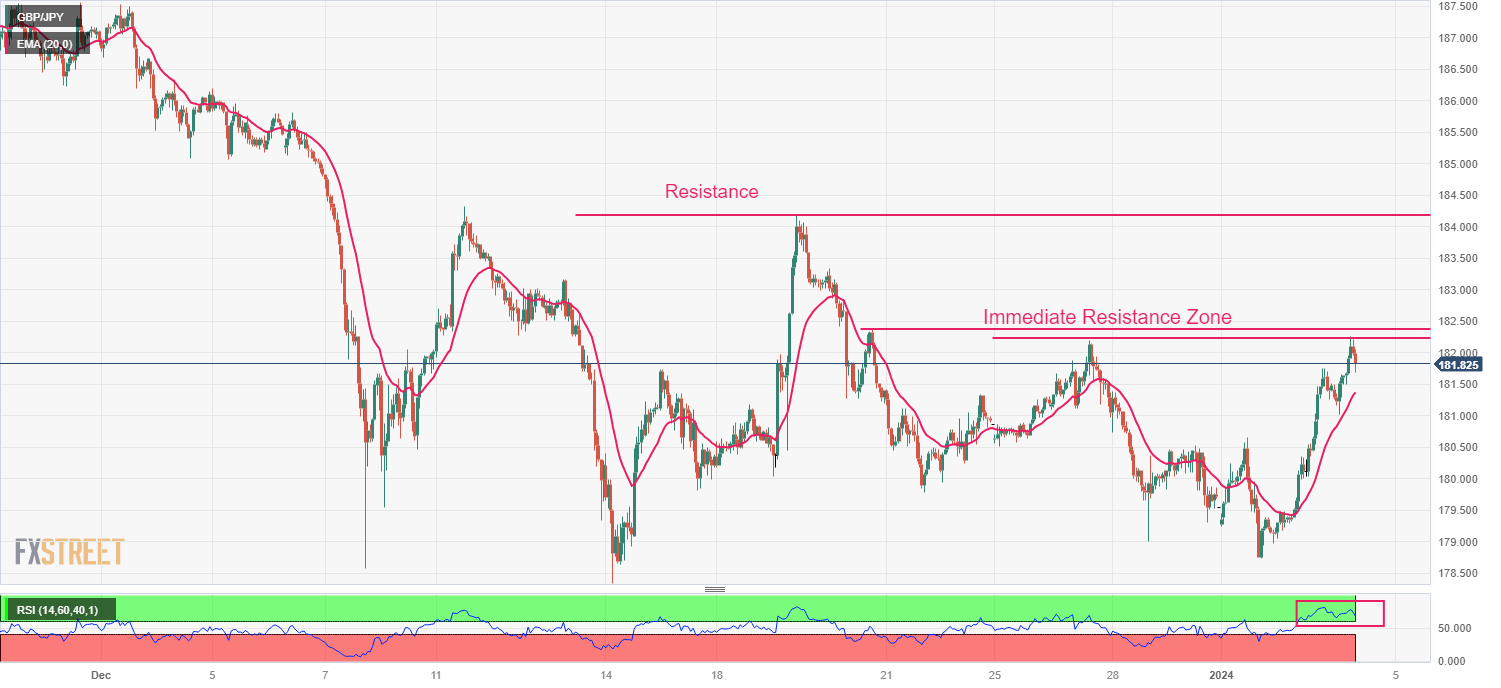
GBP/JPY rallies to near the resistance zone, which is placed in a range of 182.27-182.40 on an hourly scale. The upside bias seems upbeat as the 20-period Exponential Moving Average (EMA) is sloping higher. Further roadblock is placed near December 19 high at 184.20.

The Relative Strength Index (RSI) (14) oscillates in the bullish range of 60.00-80.00, which indicates that the upside momentum is intact.

A decisive break above the aforementioned resistance zone will expose the asset to December 13 high at 183.16, followed by December 19 high at 184.20.

Fresh downside would appear if the cross will drop below December 14 low at 178.35. This would drag the asset towards July 27 low at 177.40 and July 28 low at 176.32.

GBP/JPY hourly chart

GBP/JPY

Overview
Today last price181.73
Today Daily Change0.33
Today Daily Change %0.18
Today daily open181.4
 
Trends
Daily SMA20181.07
Daily SMA50183.82
Daily SMA100183.49
Daily SMA200179.43
 
Levels
Previous Daily High181.76
Previous Daily Low179.06
Previous Weekly High182.2
Previous Weekly Low179
Previous Monthly High187.52
Previous Monthly Low178.35
Daily Fibonacci 38.2%180.73
Daily Fibonacci 61.8%180.09
Daily Pivot Point S1179.72
Daily Pivot Point S2178.04
Daily Pivot Point S3177.03
Daily Pivot Point R1182.42
Daily Pivot Point R2183.44
Daily Pivot Point R3185.12

Author

Sagar Dua

Sagar Dua

FXStreet

Sagar Dua is associated with the financial markets from his college days. Along with pursuing post-graduation in Commerce in 2014, he started his markets training with chart analysis.

More from Sagar Dua
Share:

Editor's Picks

AUD/USD eyes 0.7150 barrier nine-day EMA

AUD/USD inches higher after registering modest losses in the previous day, trading around 0.7130 during the Asian hours. The technical analysis of the daily chart indicates that the pair is moving sideways within the rectangle pattern, suggesting a consolidation as neither the bulls nor the bears have enough momentum to take control of the market.

USD/JPY trades below 160.00 intervention threshold; bullish bias intact

The USD/JPY pair attracts some sellers during the Asian session amid fears that authorities will step in again to prop up the Japanese Yen. Furthermore, the Israel-Lebanon truce prompts some profit-taking around the US Dollar and exerts downward pressure on the currency pair.

Gold defends 200-day SMA at $4,425, but for how long?

Gold is attempting a tepid recovery toward $4,500 early Thursday, as renewed optimism in the Mideast geopolitical front calms market nerves. This cautious optimism across Asian markets weighs on Oil prices, and diminishes the US Dollar’s safe-haven appeal, helping Gold stage a decent comeback from the weekly low of $4,424.


Hyperliquid: ETF demand, capital rotation fuel HYPE rally as Bitcoin melts

Hyperliquid price sustains an upward trend near its all-time high of $75.76 on Thursday after posting 80% gains in May, while Bitcoin (BTC) retraces below $65,000, triggering a market-wide panic.

Kevin Warsh takes the Fed helm: What it means for the US Dollar
The Federal Reserve moves away from the highly predictable "forward guidance" model of the Jerome Powell era to a new “Kevin Warsh environment”, characterized by less communication, more policy surprises, and an increased focus on the Fed's complex balance sheet.
Recession on paper: What really moves the Canadian Loonie now?

Statistics Canada handed the headline writers a gift and the analysts a headache. Real GDP shrank 0.1% on an annualized basis in the first quarter, and with the fourth quarter of 2025 revised down to a 1.0% contraction, that is two negative quarters in a row, the textbook definition of a technical recession and Canada's first since the pandemic.