GBP/JPY Price Analysis: Oscillates around 172.00 as sentiment sours on US political standstill
- GBP/JPY is trading almost flat near the 172.00 mark as market sentiment dips due to a lack of agreement between the White House and the US Congress.
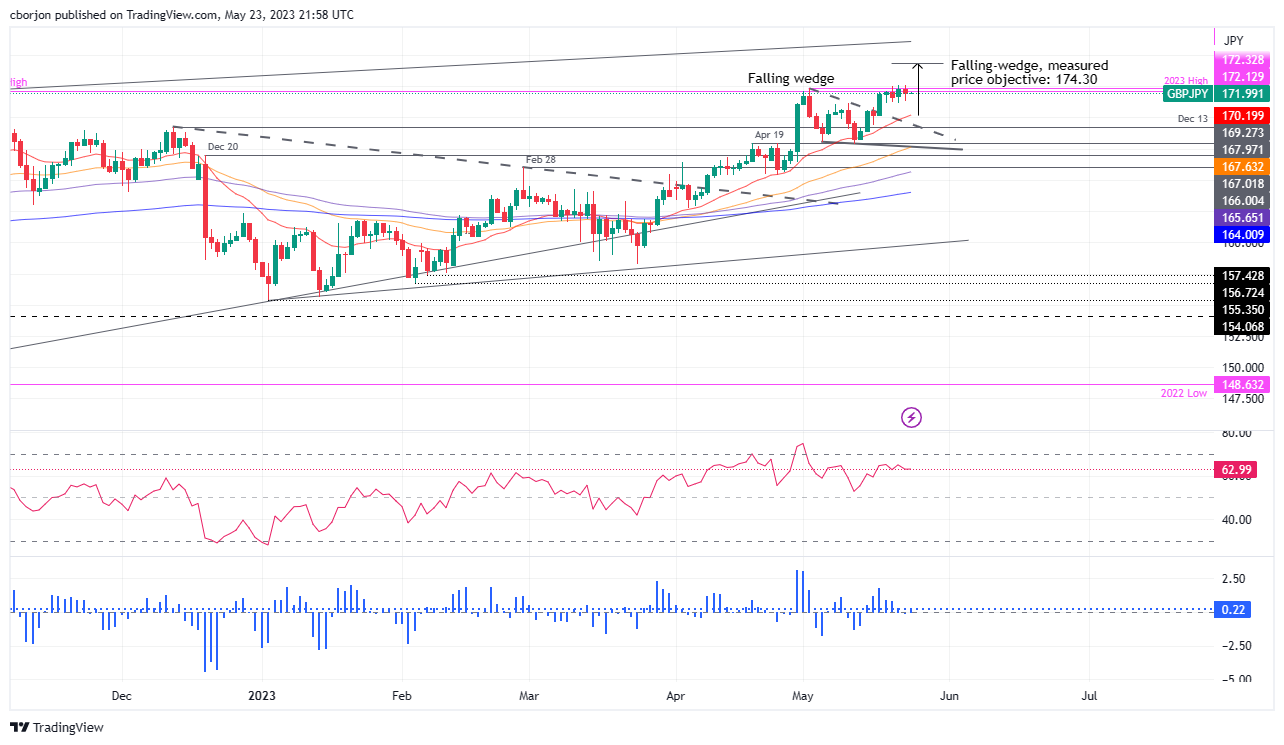
- GBP/JPY maintains an upward bias despite the stall in its rally towards the falling-wedge measured objective of 174.30.
- Clearing the 173.00 area could pave the way toward the 174.00 figure.
- Negative divergence between GBP/JPY price action and the RSI signals a pullback.

GBP/JPY retraces from around the 172.60 area and hovers nearby the 172.00 figure as market sentiment deteriorates. Failure to reach an agreement between the White House (WH) and the US Congress dampened investors’ mood as the June 1 deadline approached. As the Asian session begins, the GBP/JPY is trading at 172.01, almost flat.
GBP/JPY Price Analysis: Technical outlook
The GBP/JPY is still upward biased, but since the break of a falling wedge, the pair’s rally towards the measured objective at 174.30 stalled. In three consecutive sessions, the GBP/JPY failed to reach the 173.00 area, which, once cleared, could pave the way towards the 174.00 figure, ahead of getting the measured objective of the falling wedge.
Nevertheless, as the GBP/JPY price action achieved successive higher highs, the Relative Strength Index (RSI) indicator prints lower peaks. That means a negative divergence between price action and the RSI could open the door for a pullback.
Hence, the GBP/JPY first support is the 172.00 mark. A break below and the GBP/JPY will get to the 20-day Exponential Moving Average (EMA) at 170.20, with the 170.00 figure up for grabs.
GBP/JPY Price Action – Daily chart
Author

Christian Borjon Valencia
FXStreet
Markets analyst, news editor, and trading instructor with over 14 years of experience across FX, commodities, US equity indices, and global macro markets.


