|

GBP/JPY Price Analysis: Hovers nearby weekly highs as bulls loose steam

  • Despite a brief touch at 183.01, the GBP/JPY remains anchored below the 183.00 psychological resistance.
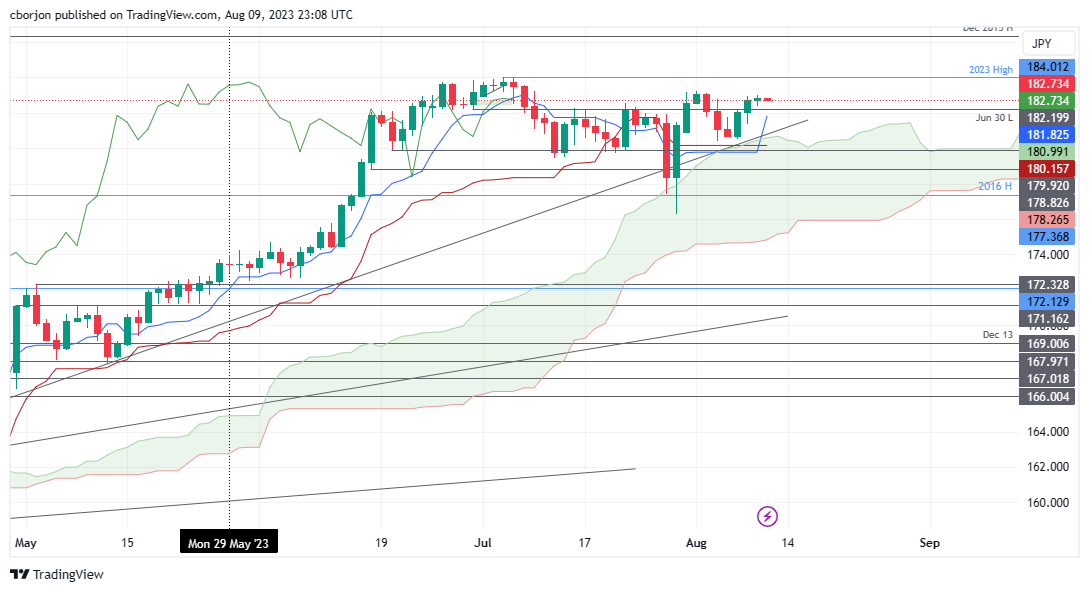
  • Key resistance lies at last week’s high of 183.24, and surpassing this could put YTD high of 184.01 into focus.
  • Support levels to watch include the August 9 low at 182.36, Tenkan-Sen at 181.82, and an established support trendline from April's lows around 180.80/95.

GBP/JPY consolidates around the weekly highs of 182.70s and prints a small candlestick, suggesting the uptrend is losing steam, despite reaching a fresh weekly high of 183.01. However, as the Asian session began, the GBP/JPY exchanged hands at 182.69, well below 183.00, after the Tenkan-Sen crossed above the Kijun-Sen level.

GBP/JPY Price Analysis: Technical outlook

From a technical perspective, the GBP/JPY remains neutral to upward bias but must reclaim the last week’s high of 183.24 to threaten the year-to-date (YTD) high of 184.01. Even though the bullish cross of the Tenkan-Sen above the Kijun-Sen portrays the GBP/JPY as bullish, further confirmation is expected.

Otherwise, if GBP/JPY dives below the August 9 low of 182.36, it would exacerbate a pullback towards the top of the Ichimoku Cloud (Kumo). The GBP/JPY’s first support would be the Tenkan-Sen at 181.82, followed by a support trendline drawn from the lows of April, at 180.80/95, before slumping towards the Kijun-Sen at 180.15, inside the Kumo.

GBP/JPY Price Action – Daily chart

GBP/JPY Daily chart

GBP/JPY

Overview
Today last price182.71
Today Daily Change-0.07
Today Daily Change %-0.04
Today daily open182.78
 
Trends
Daily SMA20181.4
Daily SMA50180.28
Daily SMA100174
Daily SMA200168.36
 
Levels
Previous Daily High182.96
Previous Daily Low181.39
Previous Weekly High183.25
Previous Weekly Low180.46
Previous Monthly High184.02
Previous Monthly Low176.32
Daily Fibonacci 38.2%182.36
Daily Fibonacci 61.8%181.99
Daily Pivot Point S1181.79
Daily Pivot Point S2180.81
Daily Pivot Point S3180.22
Daily Pivot Point R1183.37
Daily Pivot Point R2183.95
Daily Pivot Point R3184.94

Author

Christian Borjon Valencia

Markets analyst, news editor, and trading instructor with over 14 years of experience across FX, commodities, US equity indices, and global macro markets.

More from Christian Borjon Valencia
Share:

Editor's Picks

AUD/USD languishes near two-month low amid renewed Iran tensions

AUD/USD holds above 0.7000 during the Asian session on Wednesday, though it remains close to a nearly two-month low set the previous day. Fresh US strikes on Iran temper hopes for a peace deal and benefit the safe-haven US Dollar. Furthermore, inflationary concerns continue to fuel hawkish Fed expectations, lending additional support to the buck ahead of the US CPI report. Adding to this, reduced bets on an RBA rate hike in June cap the currency pair.


USD/JPY sits near 160.50 intervention zone as bulls shrug off Japan's strong PPI

USD/JPY consolidates just below mid-160.00s, or its highest level since late April, as economic concerns stemming from the Middle East conflict continue to undermine the Japanese Yen (JPY). Furthermore, a fresh wave of US strikes on Iran benefits the safe-haven US Dollar and acts as a tailwind for the currency pair, countering Japan's hotter-than-expected PPI report. However, intervention fears cap the upside as traders seem hesitant ahead of the US consumer inflation figures later this Wednesday.

Gold flirts with $4,200, lowest since March 23 on hawkish Fed bets

Gold drops to a fresh low since March 23, around the $4,200 mark during the Asian session on Wednesday, as fresh US strikes on Iran fuel inflationary concerns and bolster bets for more hawkish central banks, including the US Fed. Meanwhile, US Dollar bulls are turning cautious ahead of the US CPI report, which could limit bullion losses. However, the recent breakdown below the 200-day SMA suggests that the path of least resistance for the XAU/USD is to the downside.

Bitcoin sell-off pushes over 50% of circulating supply into loss, hinting at market bottom

Bitcoin dropped near $61,000 on Tuesday, with the latest sell-off pushing long-term market indicators toward levels historically associated with bear-market bottoms, according to a report by K33 Research.

When the chips are down, the AI tape starts to shake

The market came into Tuesday trying to sell investors the comforting ”Turnaround Tuesday” idea that Friday’s AI fracture was just another pothole on the road higher. By the close, that story had lost its bid. Monday’s dead cat bounce had done what dead cat bounces always do.

The US economy defies the rules: 100 days into the Oil shock and the recession signal is still missing

More than three months after the start of the Iran war and the resulting disruption to global energy markets, the US economy continues to display remarkable resilience. The conflict has triggered a sharp rise in Oil prices, reignited inflationary pressures and fueled widespread concerns about a potential economic slowdown.