GBP/JPY Price Analysis: Hits new YTD high, retraces, hovers around 172.30s, ahead of UK CPI


  • GBP/JPY reaches a new YTD high of 172.57, driven mainly by risk-on sentiment and a weaker JPY.
  • A negative divergence between GBP/JPY’s price action and the Relative Strength Index (RSI) indicates the potential for a pullback.
  • A continued GBP/JPY uptrend could see the pair rally toward 173.00 and potentially reach the 174.00 handle.

GBP/JPY reached a new year-to-date (YTD) high of 172.57 in the European session due to a risk-on impulse and a weaker Japanese Yen (JPY), ahead of a crucial week for the Pound Sterling (GBP). The release of PMIs in the United Kingdom (UK), alongside Wednesday’s update on the Consumer Price Index (CPI) for April, could dictate the GBP/JPY pair direction. At the time of writing, the GBP/JPY is trading at 172.34 after hitting a low of 171.19.

GBP/JPY Price Analysis: Technical outlook

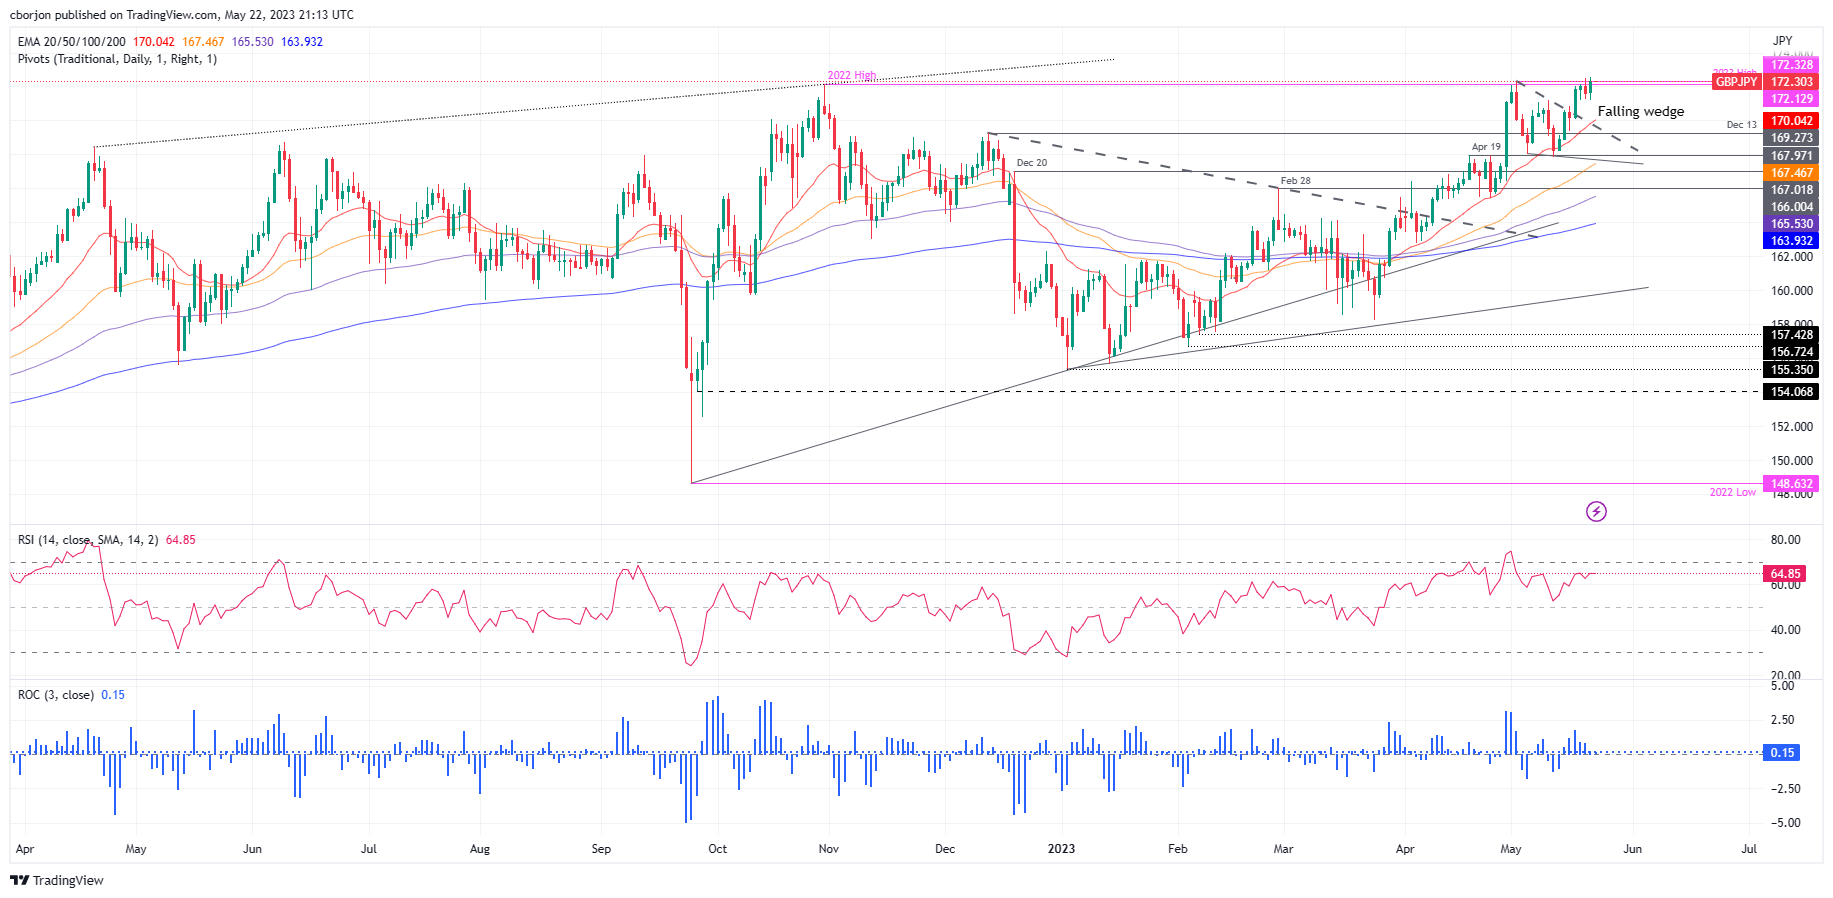
During the last week, a break of a falling wedge opened the door for the GBP/JPY to test the YTD high. As the GBP/JPY price action gathers momentum and records higher highs, the Relative Strength Index (RSI) does not. Hence, a negative divergence between price action-RSI could open the door for a test of the falling-wedge top-trendline before posing a threat to higher prices.

Therefore, the GBP/JPY is set for a pullback. The first support would be at the 172.00 figure, followed by the low of May 22 at 171.19. The break below will expose the 171.00 mark, followed by the 20-day Exponential Moving Average (EMA) at 170.04, closely followed by the falling-wedge trendline.

On the other hand, if GBP/JPY resumes its uptrend, it would need to crack the YTD high of 172.57. Once done, the pair could rally toward 173.00 before reaching the 174.00 handle.

GBP/JPY Price Action – Daily chart

GBP/JPY Daily chart

GBP/JPY

Overview
Today last price 172.38
Today Daily Change 0.72
Today Daily Change % 0.42
Today daily open 171.66
 
Trends
Daily SMA20 169.69
Daily SMA50 166.15
Daily SMA100 163.36
Daily SMA200 163.91
 
Levels
Previous Daily High 172.51
Previous Daily Low 171.25
Previous Weekly High 172.51
Previous Weekly Low 168.91
Previous Monthly High 171.18
Previous Monthly Low 162.78
Daily Fibonacci 38.2% 171.73
Daily Fibonacci 61.8% 172.03
Daily Pivot Point S1 171.1
Daily Pivot Point S2 170.55
Daily Pivot Point S3 169.84
Daily Pivot Point R1 172.36
Daily Pivot Point R2 173.07
Daily Pivot Point R3 173.62


Share: Feed news

Information on these pages contains forward-looking statements that involve risks and uncertainties. Markets and instruments profiled on this page are for informational purposes only and should not in any way come across as a recommendation to buy or sell in these assets. You should do your own thorough research before making any investment decisions. FXStreet does not in any way guarantee that this information is free from mistakes, errors, or material misstatements. It also does not guarantee that this information is of a timely nature. Investing in Open Markets involves a great deal of risk, including the loss of all or a portion of your investment, as well as emotional distress. All risks, losses and costs associated with investing, including total loss of principal, are your responsibility. The views and opinions expressed in this article are those of the authors and do not necessarily reflect the official policy or position of FXStreet nor its advertisers. The author will not be held responsible for information that is found at the end of links posted on this page.

If not otherwise explicitly mentioned in the body of the article, at the time of writing, the author has no position in any stock mentioned in this article and no business relationship with any company mentioned. The author has not received compensation for writing this article, other than from FXStreet.

FXStreet and the author do not provide personalized recommendations. The author makes no representations as to the accuracy, completeness, or suitability of this information. FXStreet and the author will not be liable for any errors, omissions or any losses, injuries or damages arising from this information and its display or use. Errors and omissions excepted.

The author and FXStreet are not registered investment advisors and nothing in this article is intended to be investment advice.

Recommended content


Recommended content

Editors’ Picks

EUR/USD extends gains above 1.0700, focus on key US data

EUR/USD extends gains above 1.0700, focus on key US data

EUR/USD meets fresh demand and rises toward  1.0750 in the European session on Thursday. Renewed US Dollar weakness offsets the risk-off market environment, supporting the pair ahead of the key US GDP and PCE inflation data. 

EUR/USD News

GBP/USD extends recovery above 1.2500, awaits US GDP data

GBP/USD extends recovery above 1.2500, awaits US GDP data

GBP/USD is catching a fresh bid wave, rising above 1.2500 in European trading on Thursday. The US Dollar resumes its corrective downside, as traders resort to repositioning ahead of the high-impact US advance GDP data for the first quarter. 

GBP/USD News

Gold price edges higher amid weaker USD and softer risk tone, focus remains on US GDP

Gold price edges higher amid weaker USD and softer risk tone, focus remains on US GDP

Gold price (XAU/USD) attracts some dip-buying in the vicinity of the $2,300 mark on Thursday and for now, seems to have snapped a three-day losing streak, though the upside potential seems limited. 

Gold News

XRP extends its decline, crypto experts comment on Ripple stablecoin and benefits for XRP Ledger

XRP extends its decline, crypto experts comment on Ripple stablecoin and benefits for XRP Ledger

Ripple extends decline to $0.52 on Thursday, wipes out weekly gains. Crypto expert asks Ripple CTO how the stablecoin will benefit the XRP Ledger and native token XRP. 

Read more

US Q1 GDP Preview: Economic growth set to remain firm in, albeit easing from Q4

US Q1 GDP Preview: Economic growth set to remain firm in, albeit easing from Q4

The United States Gross Domestic Product (GDP) is seen expanding at an annualized rate of 2.5% in Q1. The current resilience of the US economy bolsters the case for a soft landing. 

Read more

Forex MAJORS

Cryptocurrencies

Signatures