|

GBP/JPY Price Analysis: Falls to 4-month lows around 157.40s

  • GBP/JPY drops below a three-month-old upslope trendline, down since last week’s high close of around 3%.
  • The RSI at oversold conditions suggests the GBP/JPY could be bottoming, but the RoC suggests that sellers remain in charge.
  • GBP/JPY Price Analysis: Break below 157.00 would exacerbate a fall to 154.00.

The GBP/JPY plunged more than 100 pips on Monday, extending its losses to three consecutive days, once price action dived below the 200-day Exponential Moving Average (EMA). Furthermore, the cross of the 20-day EMA beneath the 200-day EMA exacerbated the acceleration of the downtrend, as the GBP/JPY gets poised to fall toward the 155.00 mark. At the time of writing, the GBP/JPY is trading at 157.46, below its opening price by 0.69%.

GBP/JPY Price Analysis: Technical outlook

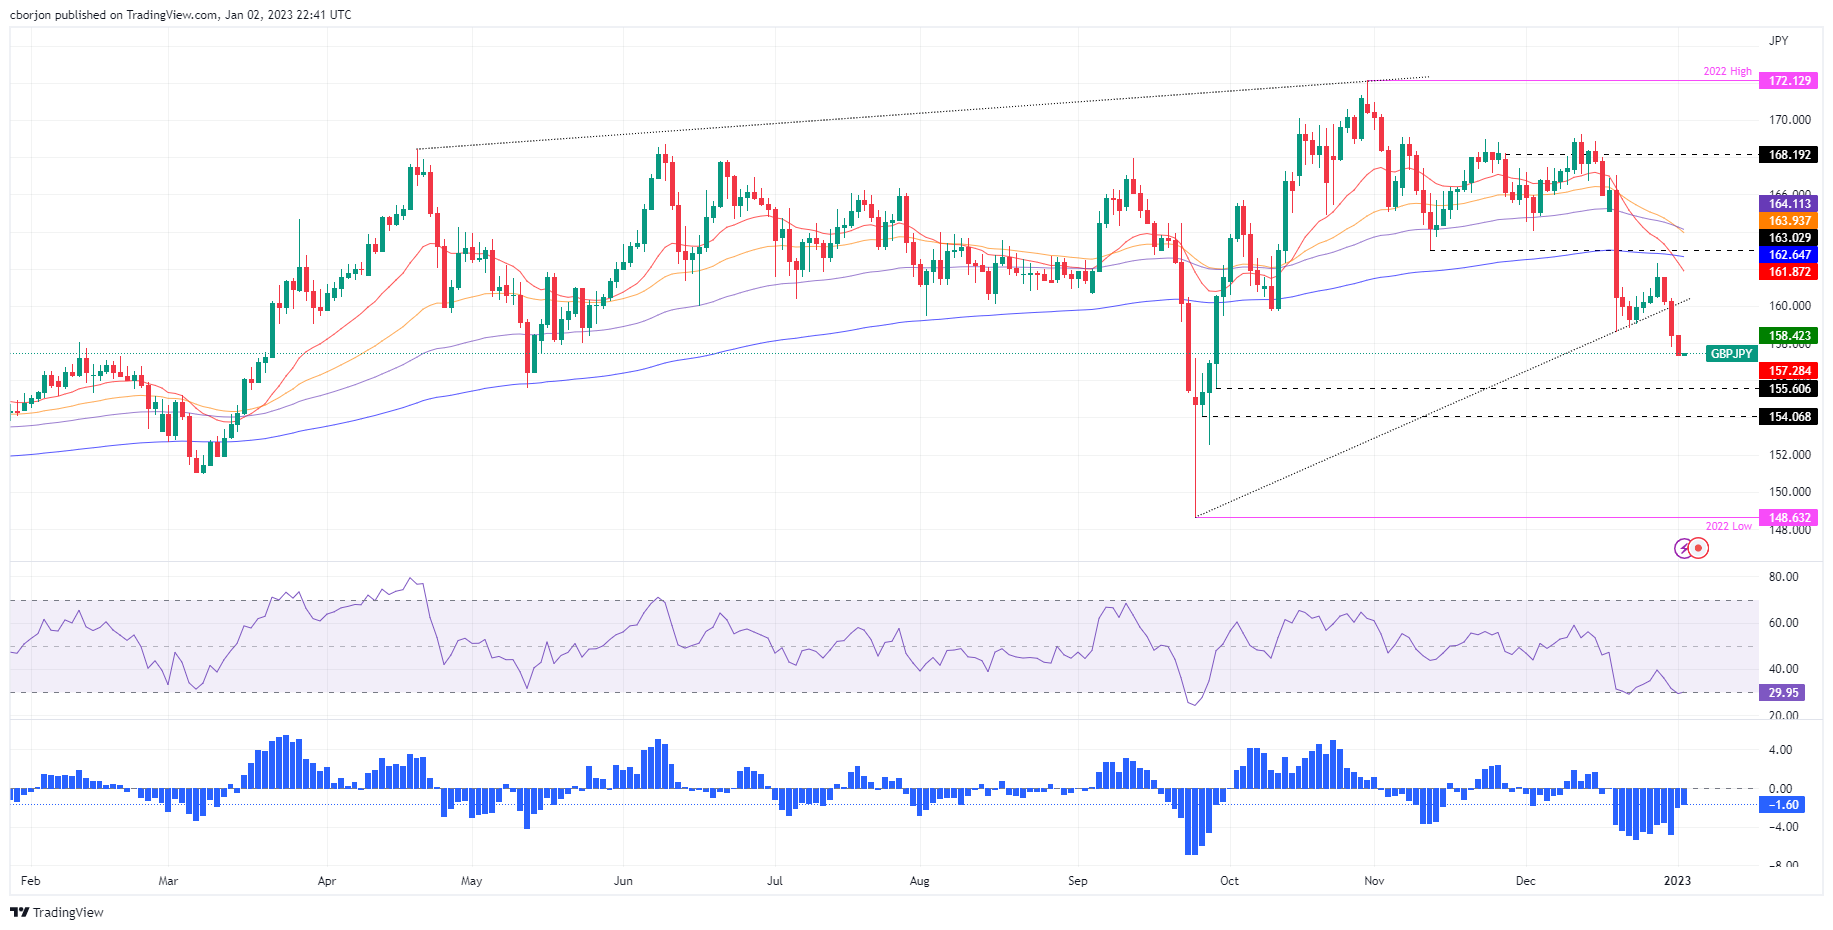
After clearing a three-month-old upslope support trendline drawn from September lows around 148.60s, the GBP/JPY fall increased its velocity. Last Thursday, the GBP/JPY formed a bearish engulfing candle pattern, followed by a tall red candle that cleared on its way south of the 160.00 figure and the previously mentioned trendline. Oscillators like the Relative Strength Index (RSI) entered oversold conditions, while the Rate of Change (RoC) shows that sellers remain gathering momentum. Therefore, the GBP/JPY might continue to fall further.

Therefore the GBP/JPY first support would be the September 29 daily low of 155.60, followed by the 155.00 mark, ahead of the September 27 swing low of 154.07.

As an alternate scenario, if GBP/JPY buyers reclaim 159.00, that could open the door to 160.00, close of the previously mentioned upslope trendline, which would be resistance, ahead of the 20-day EMA at 161.86.

GBP/JPY Key Technical Levels

GBP/JPY

Overview
Today last price157.56
Today Daily Change-1.14
Today Daily Change %-0.72
Today daily open158.7
 
Trends
Daily SMA20164.03
Daily SMA50166.02
Daily SMA100164.47
Daily SMA200163.76
 
Levels
Previous Daily High160.53
Previous Daily Low157.84
Previous Weekly High162.34
Previous Weekly Low157.84
Previous Monthly High169.28
Previous Monthly Low157.84
Daily Fibonacci 38.2%158.87
Daily Fibonacci 61.8%159.51
Daily Pivot Point S1157.52
Daily Pivot Point S2156.33
Daily Pivot Point S3154.82
Daily Pivot Point R1160.21
Daily Pivot Point R2161.72
Daily Pivot Point R3162.9

Author

Christian Borjon Valencia

Markets analyst, news editor, and trading instructor with over 14 years of experience across FX, commodities, US equity indices, and global macro markets.

More from Christian Borjon Valencia
Share:

Editor's Picks

AUD/USD stays bid above 0.7100 on Australian trade data, Mideast optimism

AUD/USD clings to minor recovery gains above 0.7100 in the Asian session on Thursday as a new Israel-Lebanon ceasefire keeps a lid on the safe-haven US Dollar. Meanwhile, strong AustralianTrade Balane data also help the Aussie pair sustain the bounce from weekly lows.

USD/JPY hovers near the 160.00 intervention threshold on Mideast tensions

USD/JPY struggles to find acceptance above 160.00 and retreats from a one-month high in the Asian session on Thursday amid fears that authorities will step in again to prop up the Japanese Yen. Furthermore, a new Israel-Lebanon ceasefire caps the US Dollar and supports the currency pair. However, renewed US-Iran tensions keep the downside limited in the Greenback and the pair.

Gold rebounds from one-week low as Israel-Lebanon truce pressures safe-haven USD

Gold gains some positive traction on Thursday and climbs to the $4,475 area during the Asian session, reversing a major part of the previous day's slide to a one-week low. The Israel-Lebanon truce prompts some profit-taking around the US Dollar and supports the commodity. 


Ethereum: Long-term holders' capitulation drives ETH below $1,800

Ethereum has fallen below $1,800 on Wednesday, the first time since May 2025 following accelerated spot selling pressure and distributions from long-term holders. The Age Consumed metric, which tracks the movement of previously idle tokens or long-term holders' coins, spiked over the past two days as prices declined, indicating increased selling activity among this cohort.

Kevin Warsh takes the Fed helm: What it means for the US Dollar
The Federal Reserve moves away from the highly predictable "forward guidance" model of the Jerome Powell era to a new “Kevin Warsh environment”, characterized by less communication, more policy surprises, and an increased focus on the Fed's complex balance sheet.
Recession on paper: What really moves the Canadian Loonie now?

Statistics Canada handed the headline writers a gift and the analysts a headache. Real GDP shrank 0.1% on an annualized basis in the first quarter, and with the fourth quarter of 2025 revised down to a 1.0% contraction, that is two negative quarters in a row, the textbook definition of a technical recession and Canada's first since the pandemic.