|

GBP/JPY Price Analysis: Double-top about to reach its target

  • The British pound weakens vs. the Japanese yen and drops 0.69%.
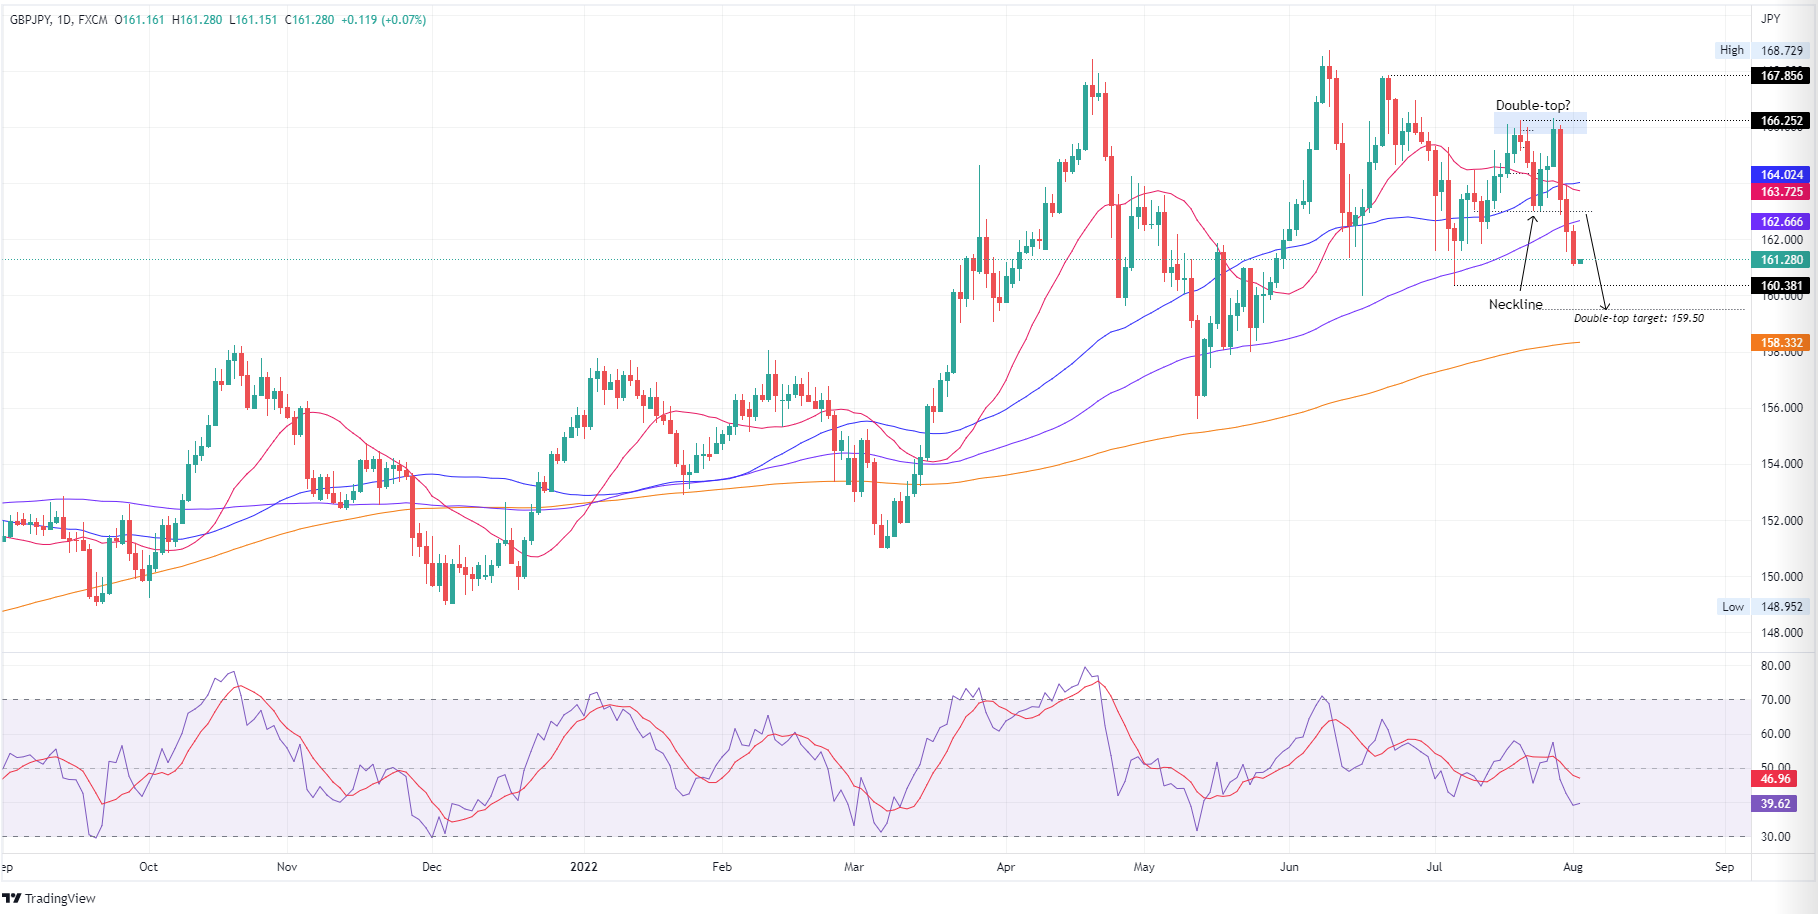
  • The GBP/JPY daily chart illustrates the double-tops stays in play, and the exchange rate is about to reach its target.
  • In the near term, the GBP/JPY might correct to 161.61 before nose-diving towards the double-top target at 159.50.

The GBP/JPY sinks for the third straight day, and the cross-currency pair accelerates towards the double-top price target at 159.50. At 161.25, the GBP/JPY reflects a dampened market mood, spurred by Fed policymakers led by Minnesota’s Fed President Kashkari, who pushed back against a Fed “dovish” tilt and opened the door for further tightening. That, alongside geopolitical tensions between the US and China, arising as the US House Speaker Nancy Pelosi could visit Taiwan.

GBP/JPY Price Analysis: Technical outlook

The GBP/JPY daily chart depicts the pair as neutral-to-downward biased. Break below 163.00, the double-top “neckline” exacerbated the fall, and on its way down, the GBP/JPY cleared the 20, 50, and 100-day EMAs. Traders should notice that the Relative Strength Index (RSI) is in negative territory and with enough room to spare before reaching oversold conditions. Therefore, a move towards the double-top target at 159.50 is on the cards, but firstly, GBP/JPY sellers need to clear the July 6 swing low at 160.38.

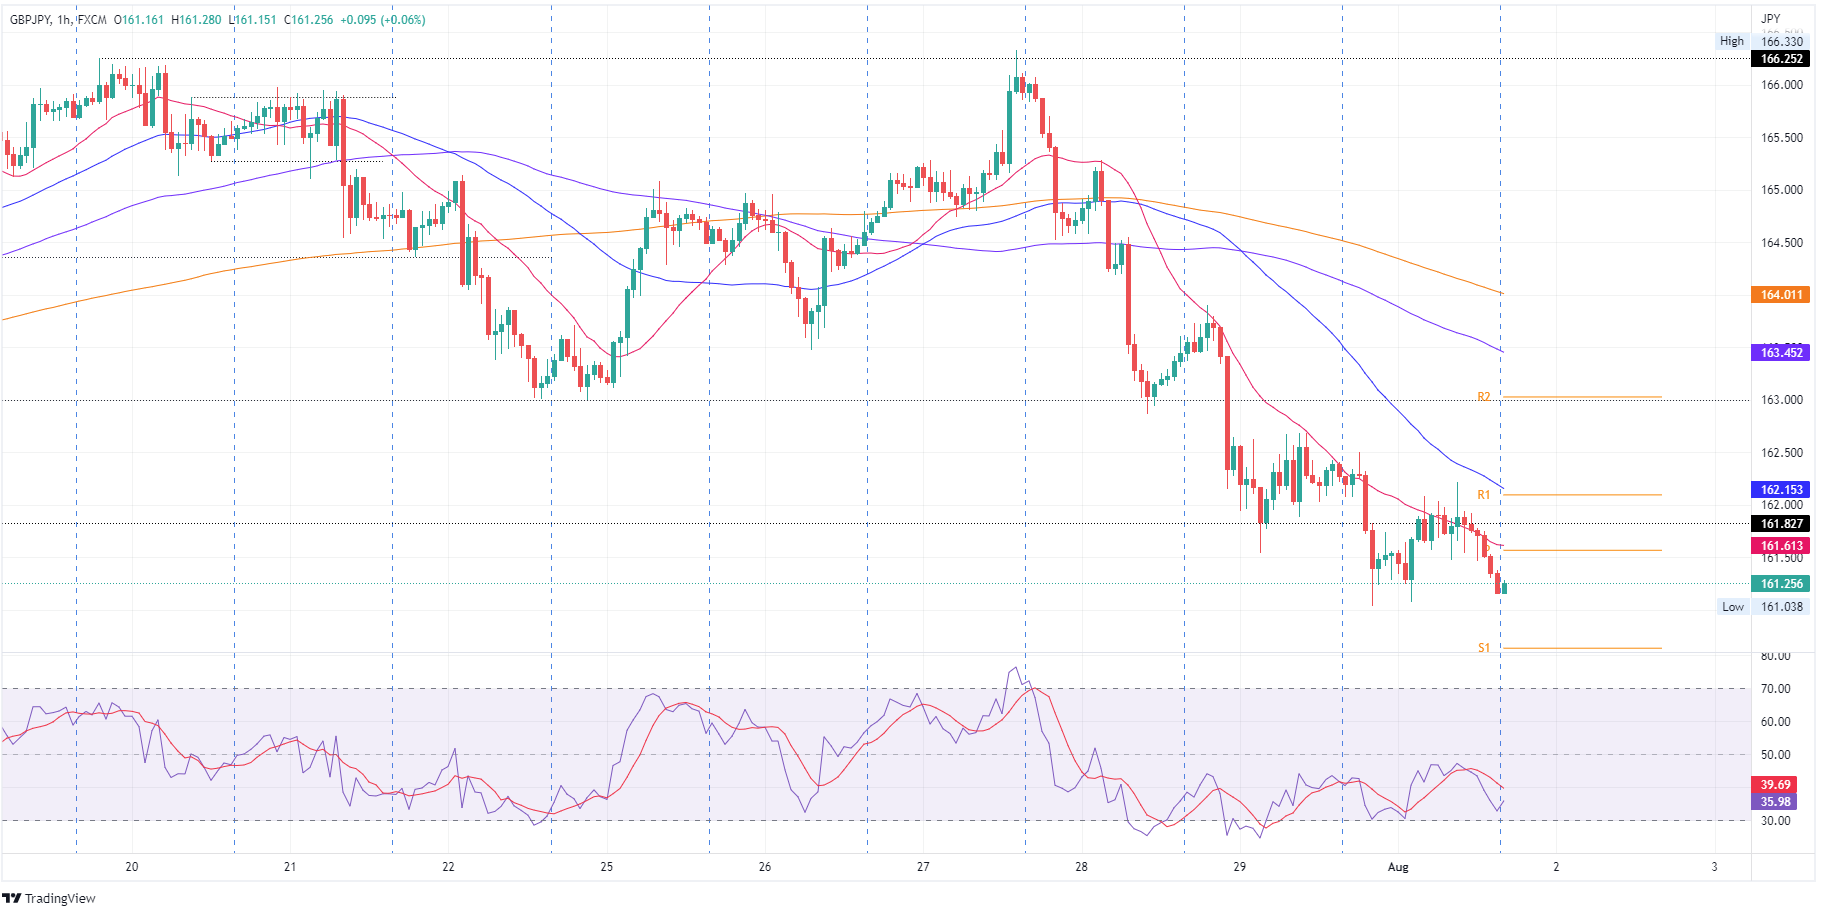
GBP/JPY 1-hour chart

In the near term, the GBP/JPY hourly chart illustrates the pair as neutral-to-downward biased, but risks are skewed to the upside. Be aware that the Relative Strength Index (RSI) at 36.72 aims to cross over the 7-hour RSI’s SMA, which could lift the pair, at least towards the confluence of the daily pivot and the 20-hour EMA at 161.61. Nevertheless, failure to do so, the GBP/JPY could dip below the 161.00 mark, towards the 160.00 figure, ahead of the double-top target at 159.50.

GBP/JPY Key Technical Levels

GBP/JPY

Overview
Today last price161.24
Today Daily Change-1.14
Today Daily Change %-0.70
Today daily open162.38
 
Trends
Daily SMA20163.96
Daily SMA50164.04
Daily SMA100162.58
Daily SMA200158.34
 
Levels
Previous Daily High163.91
Previous Daily Low161.54
Previous Weekly High166.34
Previous Weekly Low161.54
Previous Monthly High166.34
Previous Monthly Low160.4
Daily Fibonacci 38.2%162.45
Daily Fibonacci 61.8%163
Daily Pivot Point S1161.31
Daily Pivot Point S2160.24
Daily Pivot Point S3158.94
Daily Pivot Point R1163.68
Daily Pivot Point R2164.98
Daily Pivot Point R3166.05

Author

Christian Borjon Valencia

Markets analyst, news editor, and trading instructor with over 14 years of experience across FX, commodities, US equity indices, and global macro markets.

More from Christian Borjon Valencia
Share:

Editor's Picks

AUD/USD picks up amid easing geopolitical tensions, bright data from China

The Australian Dollar posts moderate gains against the US Dollar on Tuesday, regaining some of the ground lost last week, although it remains at its lowest level in nearly two months. News that Israel and Iran halted hostilities has triggered a mild relief rally. At the same time, upbeat Chinese trade data has provided additional support for the Aussie, as China is Australia’s major trading partner.

Japanese Yen steadies near recent lows as ceasefire, Japan intervention threats offset

USD/JPY trades around 160.15 on Tuesday, remaining close to its highest level since April 30 despite a broadly neutral intraday performance. The pair retains an underlying bullish bias, supported by expectations that US monetary policy will remain restrictive, although upside potential is being capped by the risk of intervention from Japanese authorities.

Gold drops to three-month lows near $4,250

The selling pressure now gathers extra pace and sends Gold to new three-month lows around $4,260 per troy punce on Tuesday. That said, the yellow metal resumes its decline on the back of a recovery attempt in the US Dollar and the likelihood of a tighter-for-longer Fed this year.

Crypto Today: Bitcoin, Ethereum, XRP edge lower despite Middle East tensions easing

Cryptocurrency prices trade amid persistent selling pressure on Tuesday. Bitcoin (BTC) hovers near $63,000, Ethereum (ETH) above $1,650, and Ripple (XRP) around $1.14.

Hotter US inflation numbers could further bolster Fed hike bets

Middle East tensions keep inflation risks elevated. Fed hike fully priced in by year end amid strong NFP report. US CPI data on Wednesday (12:30 GMT) to enter the spotlight. Further acceleration in inflation could drive the Dollar higher.

The US economy defies the rules: 100 days into the Oil shock and the recession signal is still missing

More than three months after the start of the Iran war and the resulting disruption to global energy markets, the US economy continues to display remarkable resilience. The conflict has triggered a sharp rise in Oil prices, reignited inflationary pressures and fueled widespread concerns about a potential economic slowdown.