|

GBP/JPY Price Analysis: Consolidates around 189.00 amid quiet trading on US holiday

  • GBP/JPY steady at 189.14, amid quiet trading due to US President’s Day holiday and sparse data.
  • Market eyes BoE Governor Bailey's upcoming speech and key Japanese economic reports.
  • Technical analysis indicates GBP/JPY could be on the verge of a breakout, with 189.00-191.00 as crucial range for direction.

The Pound Sterling failed to gain traction against the Japanese Yen in the mid-North American session and is flat at around 189.14, as Wall Street remains closed amid the US President’s Day holiday.

An absent economic docket in the UK and Japan has kept the GBP/JPY within familiar levels. On Tuesday, the calendar will gather momentum with the Bank of England’s (BoE) Governor Andrew Baily's speech. On the Japanese front, the schedule would remain light until Wednesday’s, with the release of the Reuters Tankan Index, and the Balance of Trade for January.

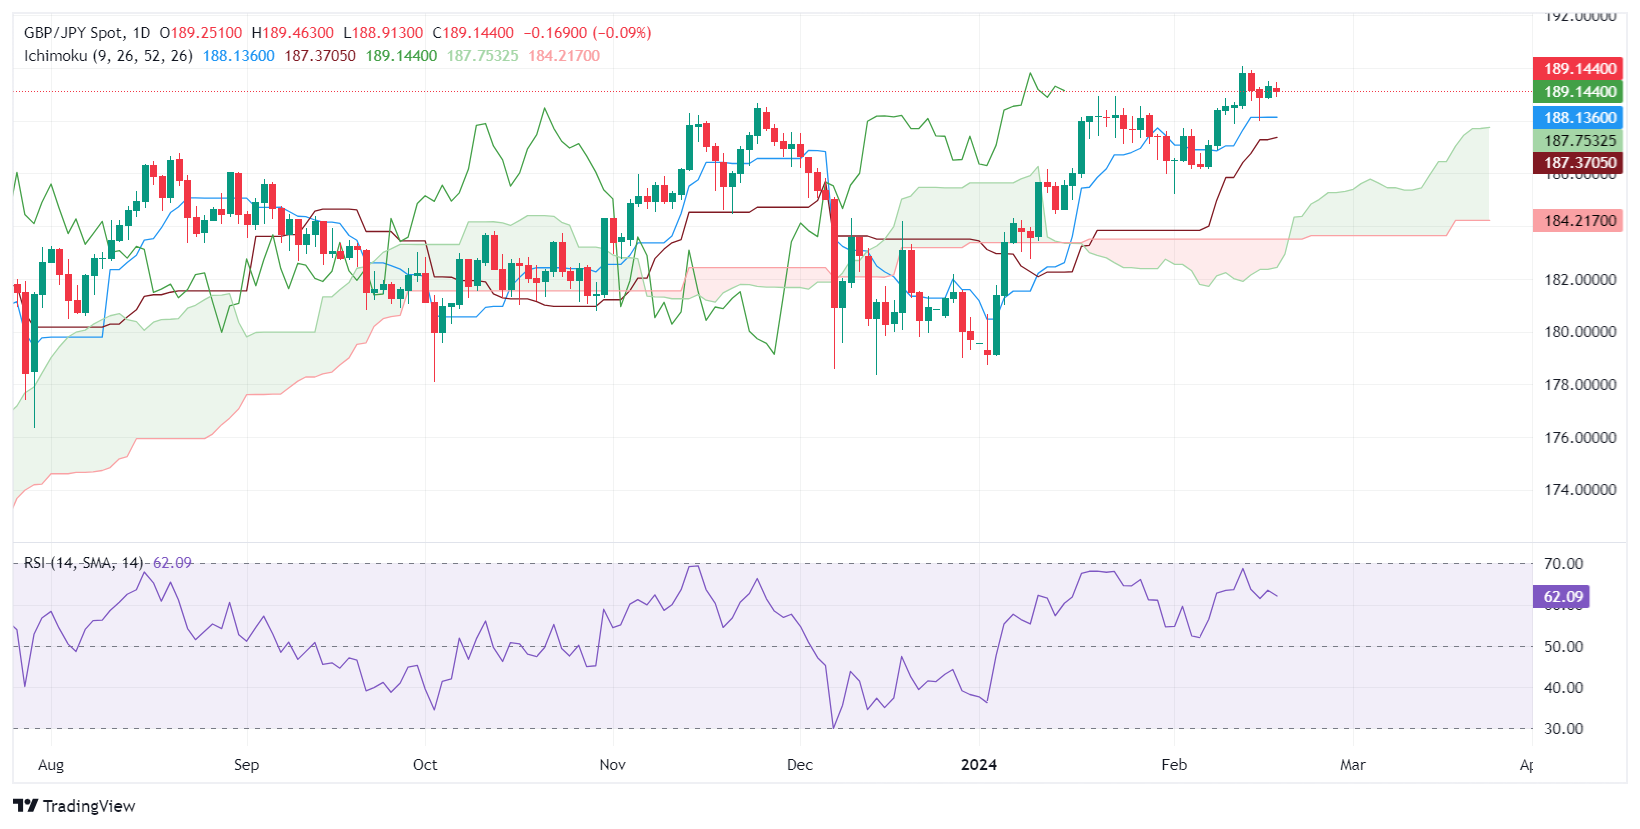
From a technical standpoint, the GBP/JPY is upward biased, though it has remained range-bound within the 189.00-190.00 figure. A breach of that level could open the door to challenging the 191.00 mark.

On the other hand, if sellers move in and drag prices below 189.00, the GBP/JPY could tumble sharply. The first support would be the Tenkan-Sen at 188.12, followed by the February 15 low of 187.92. Once those levels are cleared, the pair could aim towards the Kijun-Sen at 187.34, ahead of the 187.00 mark.

GBP/JPY Price Action – Daily Chart

GBP/JPY TECHNICAL LEVELS

Overview
Today last price189.17
Today Daily Change-0.14
Today Daily Change %-0.07
Today daily open189.31
 
Trends
Daily SMA20187.88
Daily SMA50184.86
Daily SMA100184.52
Daily SMA200182.6
 
Levels
Previous Daily High189.52
Previous Daily Low188.82
Previous Weekly High190.08
Previous Weekly Low187.86
Previous Monthly High188.94
Previous Monthly Low178.74
Daily Fibonacci 38.2%189.25
Daily Fibonacci 61.8%189.09
Daily Pivot Point S1188.92
Daily Pivot Point S2188.52
Daily Pivot Point S3188.22
Daily Pivot Point R1189.61
Daily Pivot Point R2189.91
Daily Pivot Point R3190.31

Author

Christian Borjon Valencia

Markets analyst, news editor, and trading instructor with over 14 years of experience across FX, commodities, US equity indices, and global macro markets.

More from Christian Borjon Valencia
Share:

Editor's Picks

EUR/USD seems fragile below 1.1700 as Middle East war boosts energy prices

The EUR/USD pair trades flat at around 1.1680 during the Asian trading session on Tuesday, but broadly seems vulnerable, being close to its five-week low. The major currency pair is under pressure as surging oil prices due to the United States-Israel war with Iran have increased the risks of higher inflation for the Old Continent.

GBP/USD hovers around 1.3400 with bearish pressure intact

GBP/USD edges higher after three days of losses, trading around 1.3400 during the Asian hours on Tuesday. The technical analysis of the daily chart indicates an ongoing bearish bias, as the pair trades within a descending channel pattern.

Gold sticks to gains above $5,350 amid sustained safe-haven demand; firmer USD caps gains

Gold sticks to its positive bias for the third straight day and trades above the $5,350 level heading into the European session on Tuesday. Concerns about a broader regional conflict in the Middle East continue to weigh on investors' sentiment and underpin demand for the traditional safe-haven bullion.

Stellar risks deeper losses as derivatives metrics turn negative

Stellar is trading red below $0.16 at the time of writing on Tuesday, after a slight recovery the previous day. Weakening derivatives data caps the recovery, while an unfavorable technical outlook projects a deeper correction for the XLM token in the upcoming days.

The market is not panicking it is repricing the probability distribution of Oil and time

At the end of the day, markets do not trade morality or geopolitics. They trade transmission channels. And the only channel that truly matters in this maelstrom runs through the price of energy and the time value of money.

Grass 20% bullish breakout defies broader market weakness

Grass (GRASS) is edging up above $0.30 at the time of writing on Monday. The token’s notable 20% intraday surge stands out amid heightened volatility in the broader crypto market.