GBP/JPY Price Analysis: Bulls maintain stronghold, despite profit take-off


  • The daily chart shows that the bulls are taking their foot off the gas and started to take profits.
  • The hourly chart shows signs of short-term selling pressure ahead of the Asian session.
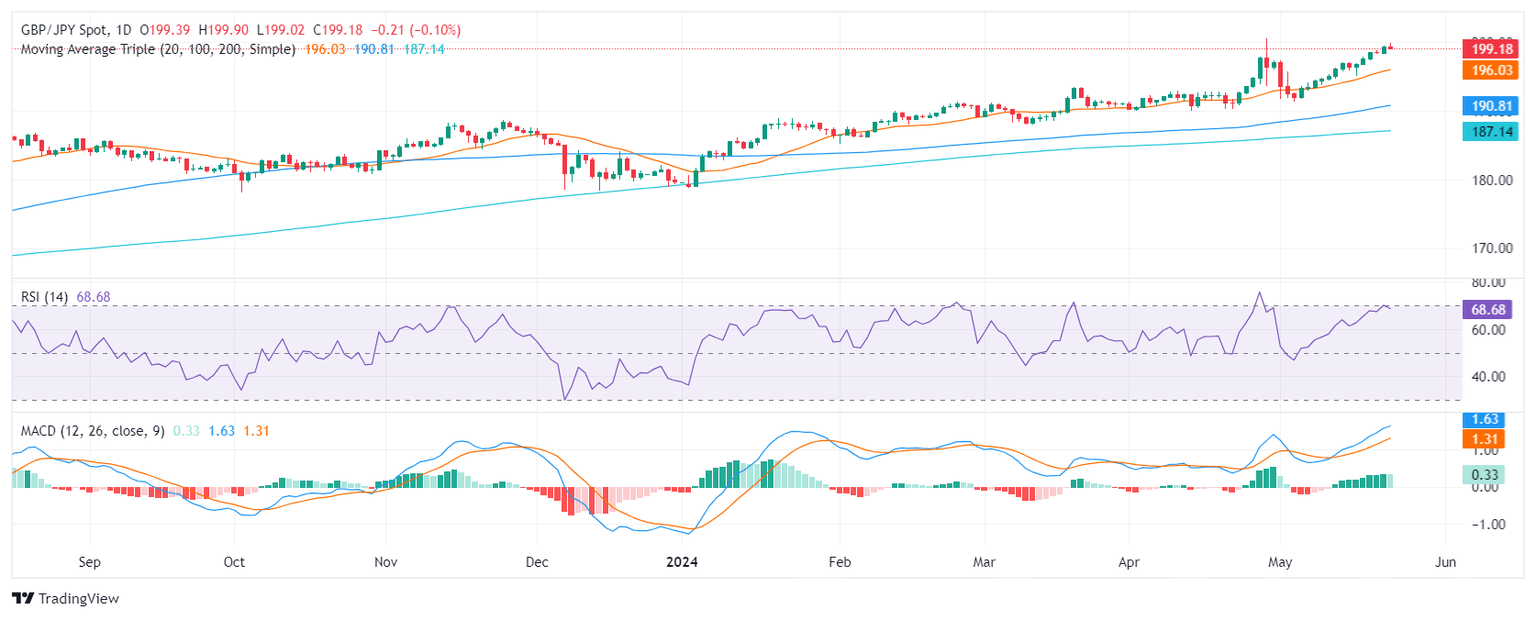
  • The main support to hold is the 20-day SMA at 196.00.

On Thursday's session, the GBP/JPY declined to 199.20 but holds an overall positive outlook. This theory is backed up by the pair approaching near-cycle highs. If the cross holds the 20-day Simple Moving Average (SMA) at 196.00, the downward movements could be considered corrective.

In the daily chart, the Relative Strength Index (RSI) exhibits heightened bullish momentum as it comfortably resides in positive territory nearing overbought conditions but seems to be flattening. Simultaneously, the Moving Average Convergence Divergence (MACD) reveals a decreasing bullish momentum, distinguished by falling green bars. This indicates that while buyers currently hold the reins, their influence may be abating.

GBP/JPY daily chart
Switching to the hourly chart, the RSI portrays a contrasting bearish tendency, with the latest reading of approximately 44, dipping into negative territory. A declining trend is corroborated by the MACD's ascending red bars, suggesting a surge in negative momentum as sellers gain influence in the short term.

GBP/JPY hourly chart
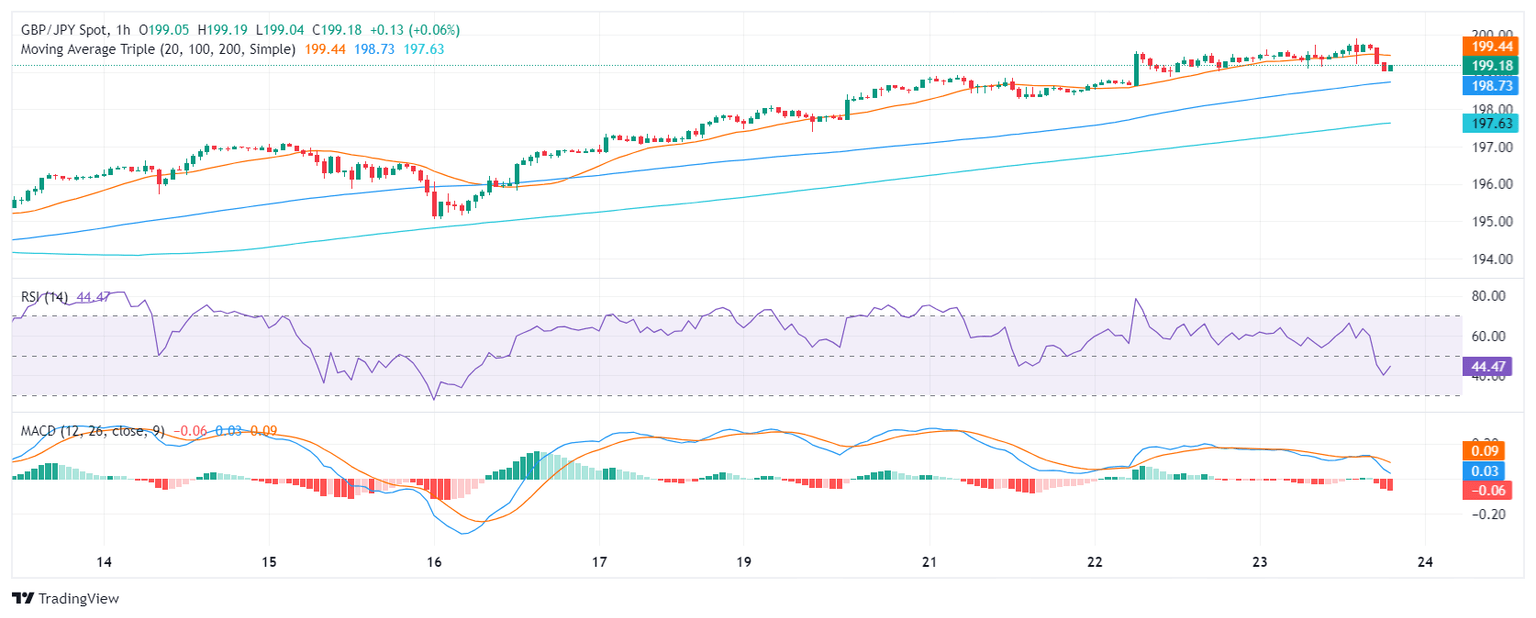
To conclude, the GBP/JPY pair rose near cycle highs, and indicators reached overbought conditions which may trigger a corrective phase. Ahead of the Asian session, investors are taking profits, evident in the hourly chart where indicators are in the red. However, as long as the pair holds above the 20,100 and 200-day SMAs, the outlook will be bullish.


GBP/JPY

Overview
Today last price 199.17
Today Daily Change -0.22
Today Daily Change % -0.11
Today daily open 199.39
 
Trends
Daily SMA20 195.81
Daily SMA50 193.25
Daily SMA100 190.65
Daily SMA200 187.07
 
Levels
Previous Daily High 199.54
Previous Daily Low 198.38
Previous Weekly High 197.86
Previous Weekly Low 194.74
Previous Monthly High 200.59
Previous Monthly Low 190
Daily Fibonacci 38.2% 199.1
Daily Fibonacci 61.8% 198.83
Daily Pivot Point S1 198.66
Daily Pivot Point S2 197.94
Daily Pivot Point S3 197.5
Daily Pivot Point R1 199.83
Daily Pivot Point R2 200.27
Daily Pivot Point R3 200.99


Share: Feed news

Information on these pages contains forward-looking statements that involve risks and uncertainties. Markets and instruments profiled on this page are for informational purposes only and should not in any way come across as a recommendation to buy or sell in these assets. You should do your own thorough research before making any investment decisions. FXStreet does not in any way guarantee that this information is free from mistakes, errors, or material misstatements. It also does not guarantee that this information is of a timely nature. Investing in Open Markets involves a great deal of risk, including the loss of all or a portion of your investment, as well as emotional distress. All risks, losses and costs associated with investing, including total loss of principal, are your responsibility. The views and opinions expressed in this article are those of the authors and do not necessarily reflect the official policy or position of FXStreet nor its advertisers. The author will not be held responsible for information that is found at the end of links posted on this page.

If not otherwise explicitly mentioned in the body of the article, at the time of writing, the author has no position in any stock mentioned in this article and no business relationship with any company mentioned. The author has not received compensation for writing this article, other than from FXStreet.

FXStreet and the author do not provide personalized recommendations. The author makes no representations as to the accuracy, completeness, or suitability of this information. FXStreet and the author will not be liable for any errors, omissions or any losses, injuries or damages arising from this information and its display or use. Errors and omissions excepted.

The author and FXStreet are not registered investment advisors and nothing in this article is intended to be investment advice.

Recommended content


Recommended content

Editors’ Picks

EUR/USD extends slide below 1.0700 on stronger USD, EU political angst

EUR/USD extends slide below 1.0700 on stronger USD, EU political angst

EUR/USD stays under bearish pressure and trades at its lowest level since early May below 1.0700. Unabated US Dollar demand amid risk aversion and looming EU political uncertainty exert downside pressure on the pair heading into the weekend.

EUR/USD News

GBP/USD slumps to multi-week lows below 1.2700

GBP/USD slumps to multi-week lows below 1.2700

GBP/USD extends its decline on Friday and trades at its lowest level in nearly a month below 1.2700. In the absence of high-tier data releases, the US Dollar continues to benefit from souring market mood, forcing the pair to stretch lower in the second half of the day.

GBP/USD News

Gold clings to recovery gains at around $2,330

Gold clings to recovery gains at around $2,330

Following Thursday's pullback, Gold holds its ground on Friday and trades in positive territory near $2,330. The benchmark 10-year US Treasury bond yield edges lower toward 4.2%, helping XAU/USD push higher ahead of the weekend.

Gold News

Monero price poised for a downward correction

Monero price poised for a downward correction

Monero price has encountered resistance at a critical level. The technical outlook suggests a potential short-term correction as momentum indicators signal a bearish divergence.

Read more

Week ahead – RBA, SNB and BoE next to decide, CPI and PMI data also on tap

Week ahead – RBA, SNB and BoE next to decide, CPI and PMI data also on tap

It will be another central-bank-heavy week with the RBA, SNB and BoE. Retail sales will be the highlight in the United States. Plenty of other data also on the way, including flash PMIs and UK CPI.

Read more

Forex MAJORS

Cryptocurrencies

Signatures