GBP/JPY Price Analysis: Breaks to two-week highs, but retraces near 165.00
- GBP/JPY rose close to 190 pips but retraced almost 100 pips, on market mood turning soar.
- The cross-currency pair tumbled below substantial resistance, exposing the 165.00 mark to selling pressure.
- GBP/JPY Price Analysis: Neutral-upwards, but downside risks remain if sellers drag prices below 165.00.

The GBP/JPY finished Monday’s trading session in positive territory, up 0.45%, after reaching a daily high at 166.09, in the middle of the US session, to then tumble on recession fears that some US companies, namely Apple and Goldman Sachs, said that they would halt hiring, meaning that businesses are bracing for slower economic growth.
That said, the GBP/JPY is trading at 165.06 at the time of writing, as Tuesday’s Asian Pacific session begins, around the daily pivot and the 20-hour EMA.
GBP/JPY Price Analysis: Technical outlook
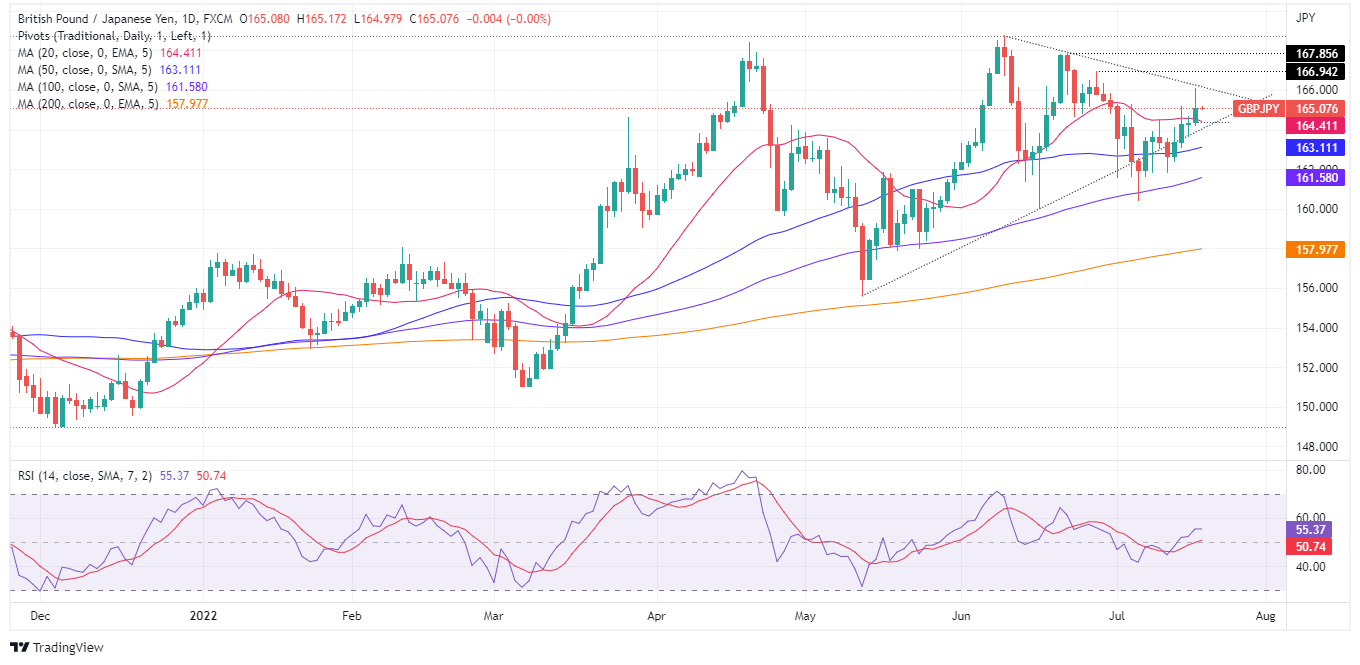
GBP/JPY Daily chart
The GBP/JPY is still neutral-upwards biased, with the daily EMAs below the spot price. GBP/JPY traders should notice that whilst the previously mentioned are still bullish positioned, they are closing to price action, meaning that the uptrend is losing steam. Also, the Relative Strength Index (RSI) turned from bullish to flat, meaning that the GBP/JPY price might be about to top, opening the door for shorts.
If that scenario plays out, the GBP/JPY first support would be 165.00. Break of the double-zero support will send the cross towards the 20-day EMA at 164.41, followed by the 50-day EMA at 163.11. Otherwise, if the GBP/JPY aims higher, the cross first resistance would be July’s 18 daily high at 166.09. Once cleared, the next resistance would be June’s 28 high at 166.94, followed by June 22 cycle high at 167.85.
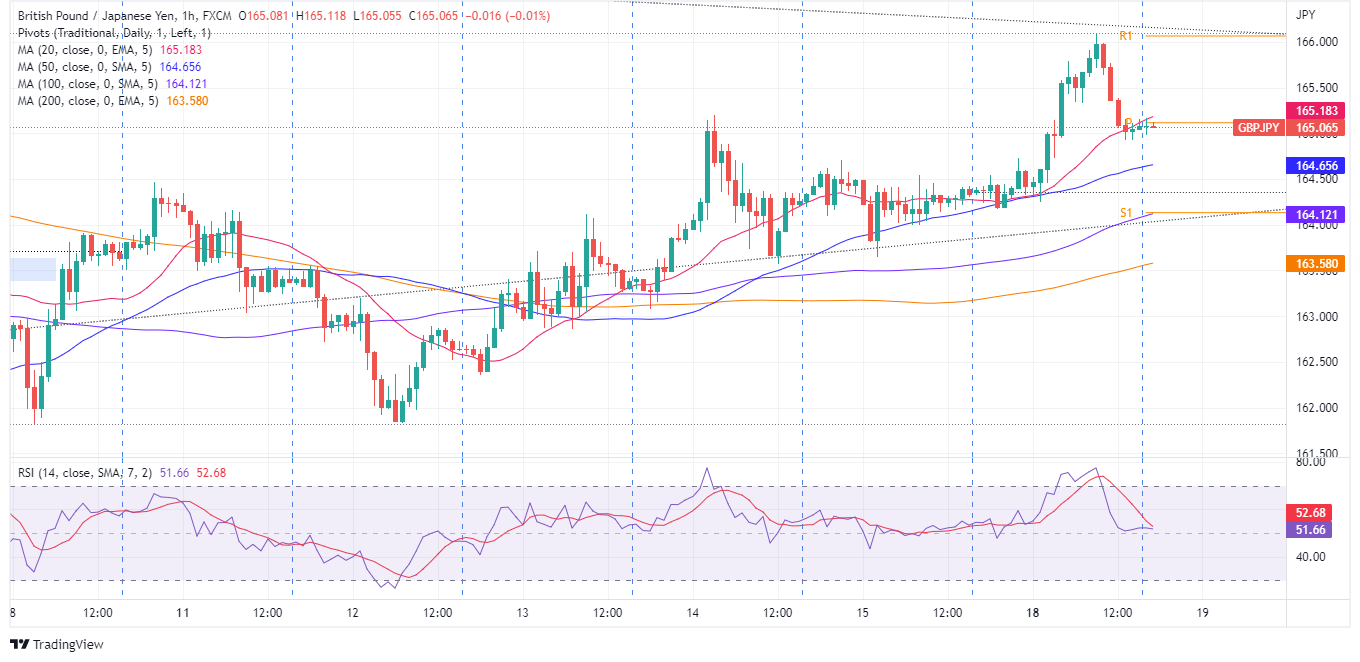
GBP/JPY 1-hour chart
The GBP/JPY near-term perspective depicts the pair as also neutral-upwards. Nevertheless, the later drop in market mood shift sent the cross below July 14 daily high at 165.19, which could open the door for further selling pressure. GBP/JPY traders should be aware that the exchange rate is below the 20-hour EMA at 165.18, usually a sign of bearishness in the near term. Worth mentioning that the GBP/JPY is trading below the daily pivot point, suggesting some solid resistance lies above.
Therefore, the GBP/JPY path of least resistance is downwards. That said, the first support would be the double-zero at 165.00. Break below will expose the 50-hour EMA at 164.66, followed by the confluence of the S1 and the 100-hour EMA At 164.12. Once broken, the next support would be the 200-hour EMA at 163.58.
GBP/JPY Key Technical Levels
Author

Christian Borjon Valencia
FXStreet
Markets analyst, news editor, and trading instructor with over 14 years of experience across FX, commodities, US equity indices, and global macro markets.


