GBP/CAD Price Prediction: Bearish Shooting Star candlestick at top of rising channel
- GBP/CAD has formed a bearish candlestick pattern after briefly breaking above a channel line.
- This could be a sign a pullback is about to unfold, however, downside pressure has been limited so far.

GBP/CAD has temporarily broken above the upper channel line of a long-term rising channel before falling back down and closing (on Friday) near where it opened.
The pattern thus formed is a Japanese Shooting Star candlestick (orange rectangle on chart below) which is a short-term bearish sign, especially if followed up by a bearish down day, as seems to be the case (so far) on Monday.
GBP/CAD Daily Chart
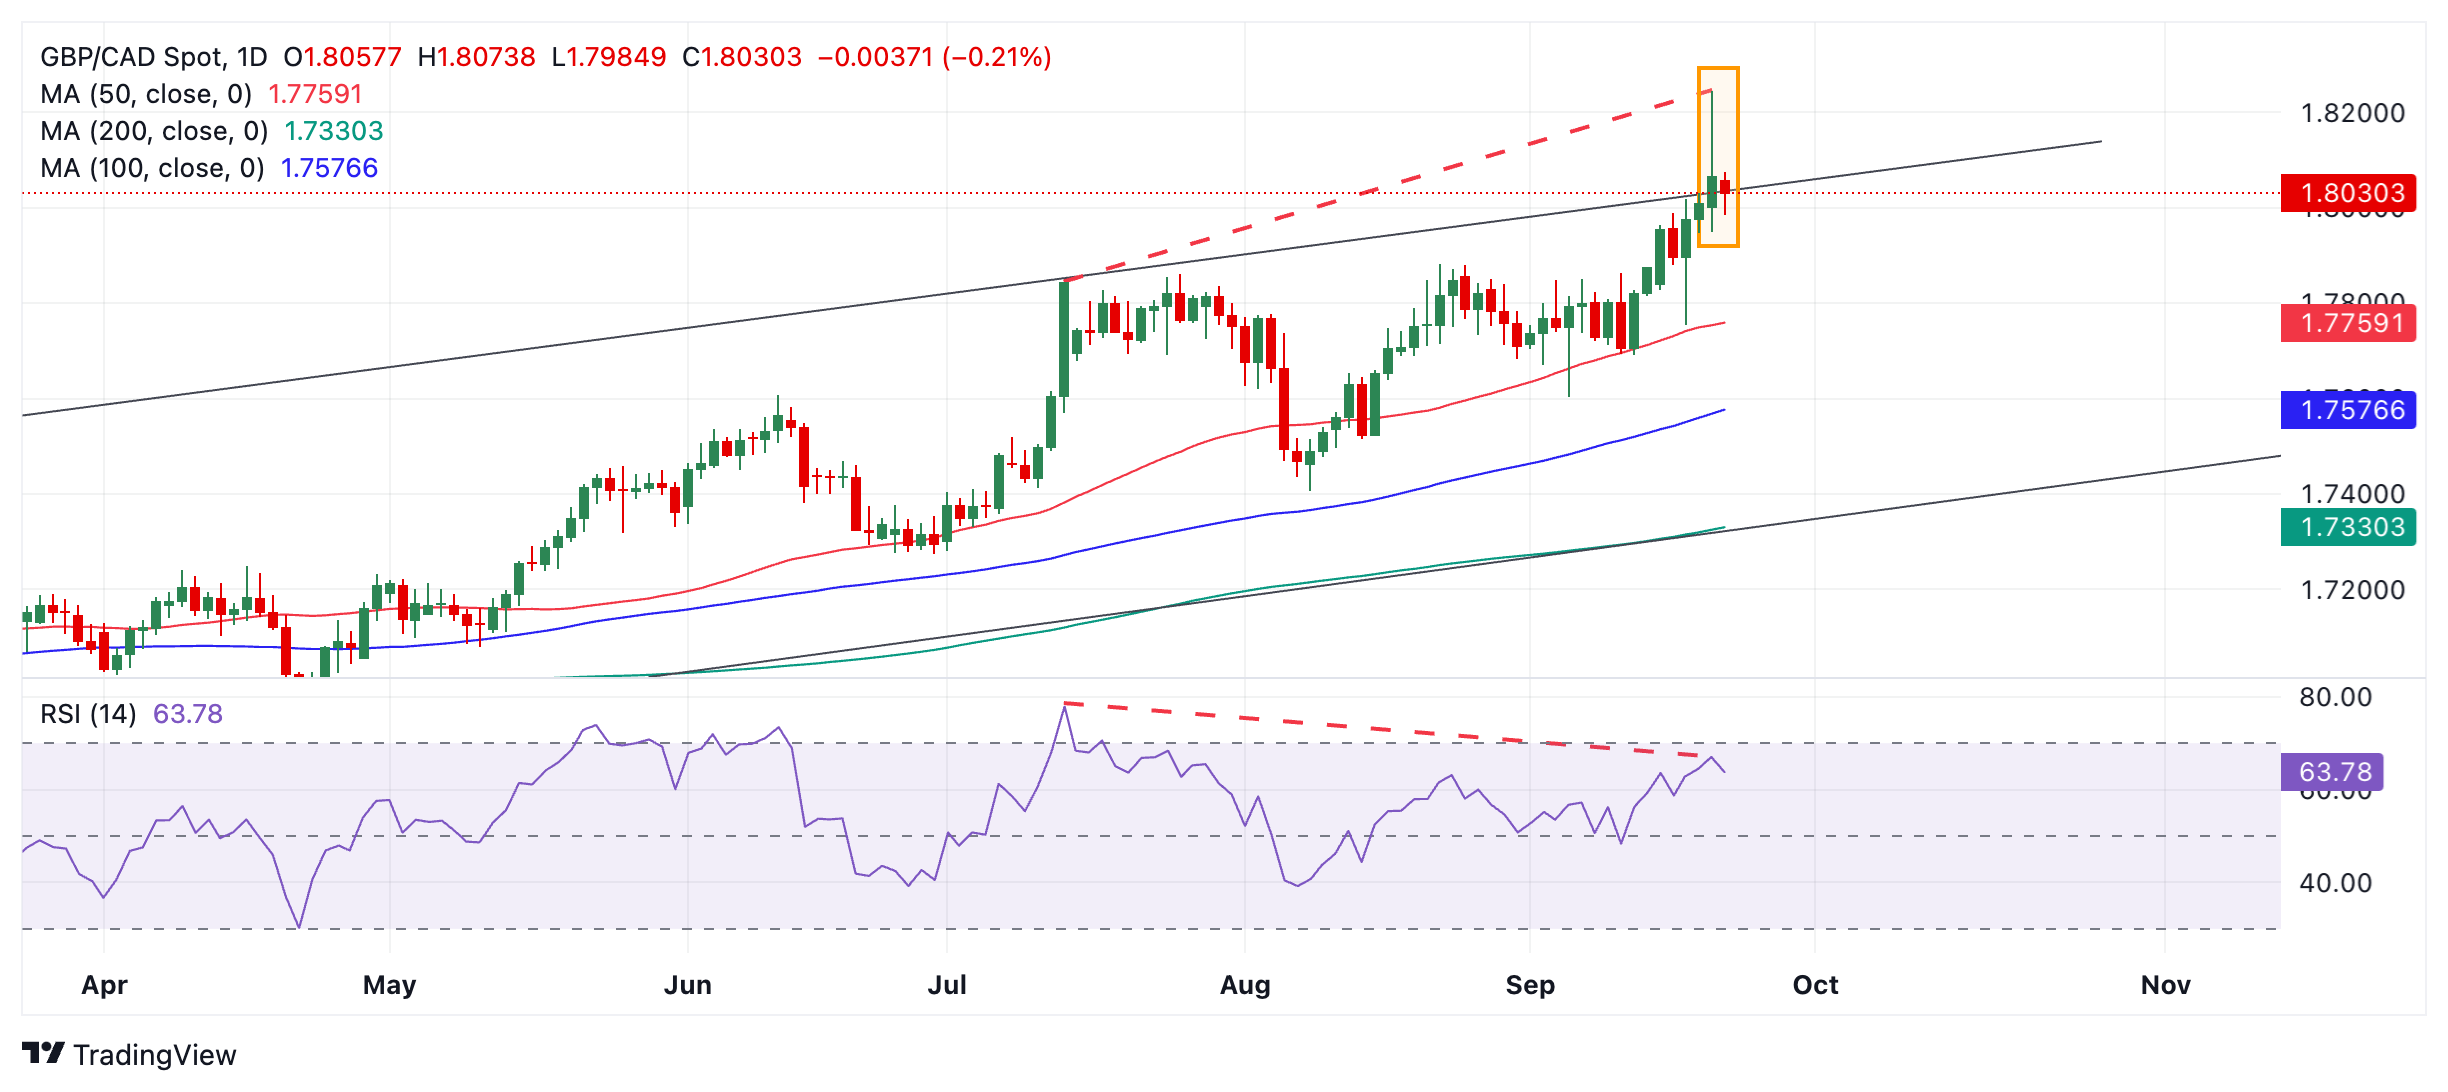
That said, GBP/CAD is in an uptrend on all three major time frames – the short, medium and long-term. This suggests that overall the “current” is flowing north. Given it is a principle of technical analysis that “the trend is your friend” this would suggest the odds continue to favor more upside.
However, GBP/CAD is also showing bearish divergence with the Moving Average Convergence Divergence (MACD) momentum indicator (red dashed lines). Although the price has risen to a much higher peak compared to July 12, the MACD is actually lower. This is a bearish sign and suggests a higher chance of a pull back evolving. Given the strong overarching uptrend, however, the pullback might just be a temporary sell-off.
If there is a correction, however, it might reach the 50-day Simple Moving Average (SMA) at 1.7753.
Alternatively, a break above the high of the Shooting Star at 1.8245 would probably confirm that price is going even higher. If so, it might reach a target at 1.8278, the 61.8% extrapolation of the prior move higher.
Any further bullishness beyond the confines of the channel is likely to be short-lived. Such moves often signal “exhaustion” and are a precursor to deeper corrections on the horizon.
Author

Joaquin Monfort
FXStreet
Joaquin Monfort is a financial writer and analyst with over 10 years experience writing about financial markets and alt data. He holds a degree in Anthropology from London University and a Diploma in Technical analysis.


