|

GBP/CAD Price Forecast: Unfolds down leg within rising channel

  • GBP/CAD is undergoing a sharp decline within a rising channel. 
  • It is likely to continue lower as the counter-trend reaction runs its course. 

GBP/CAD is unfolding a down leg within a rising channel. It will probably continue lower to at least the blue 100-day Simple Moving Average (SMA) at 1.7641. 

The pair is in a short-term downtrend, and given the principle that “the trend is your friend,” the odds favor a continuation of that trend. 

GBP/CAD Daily Chart 

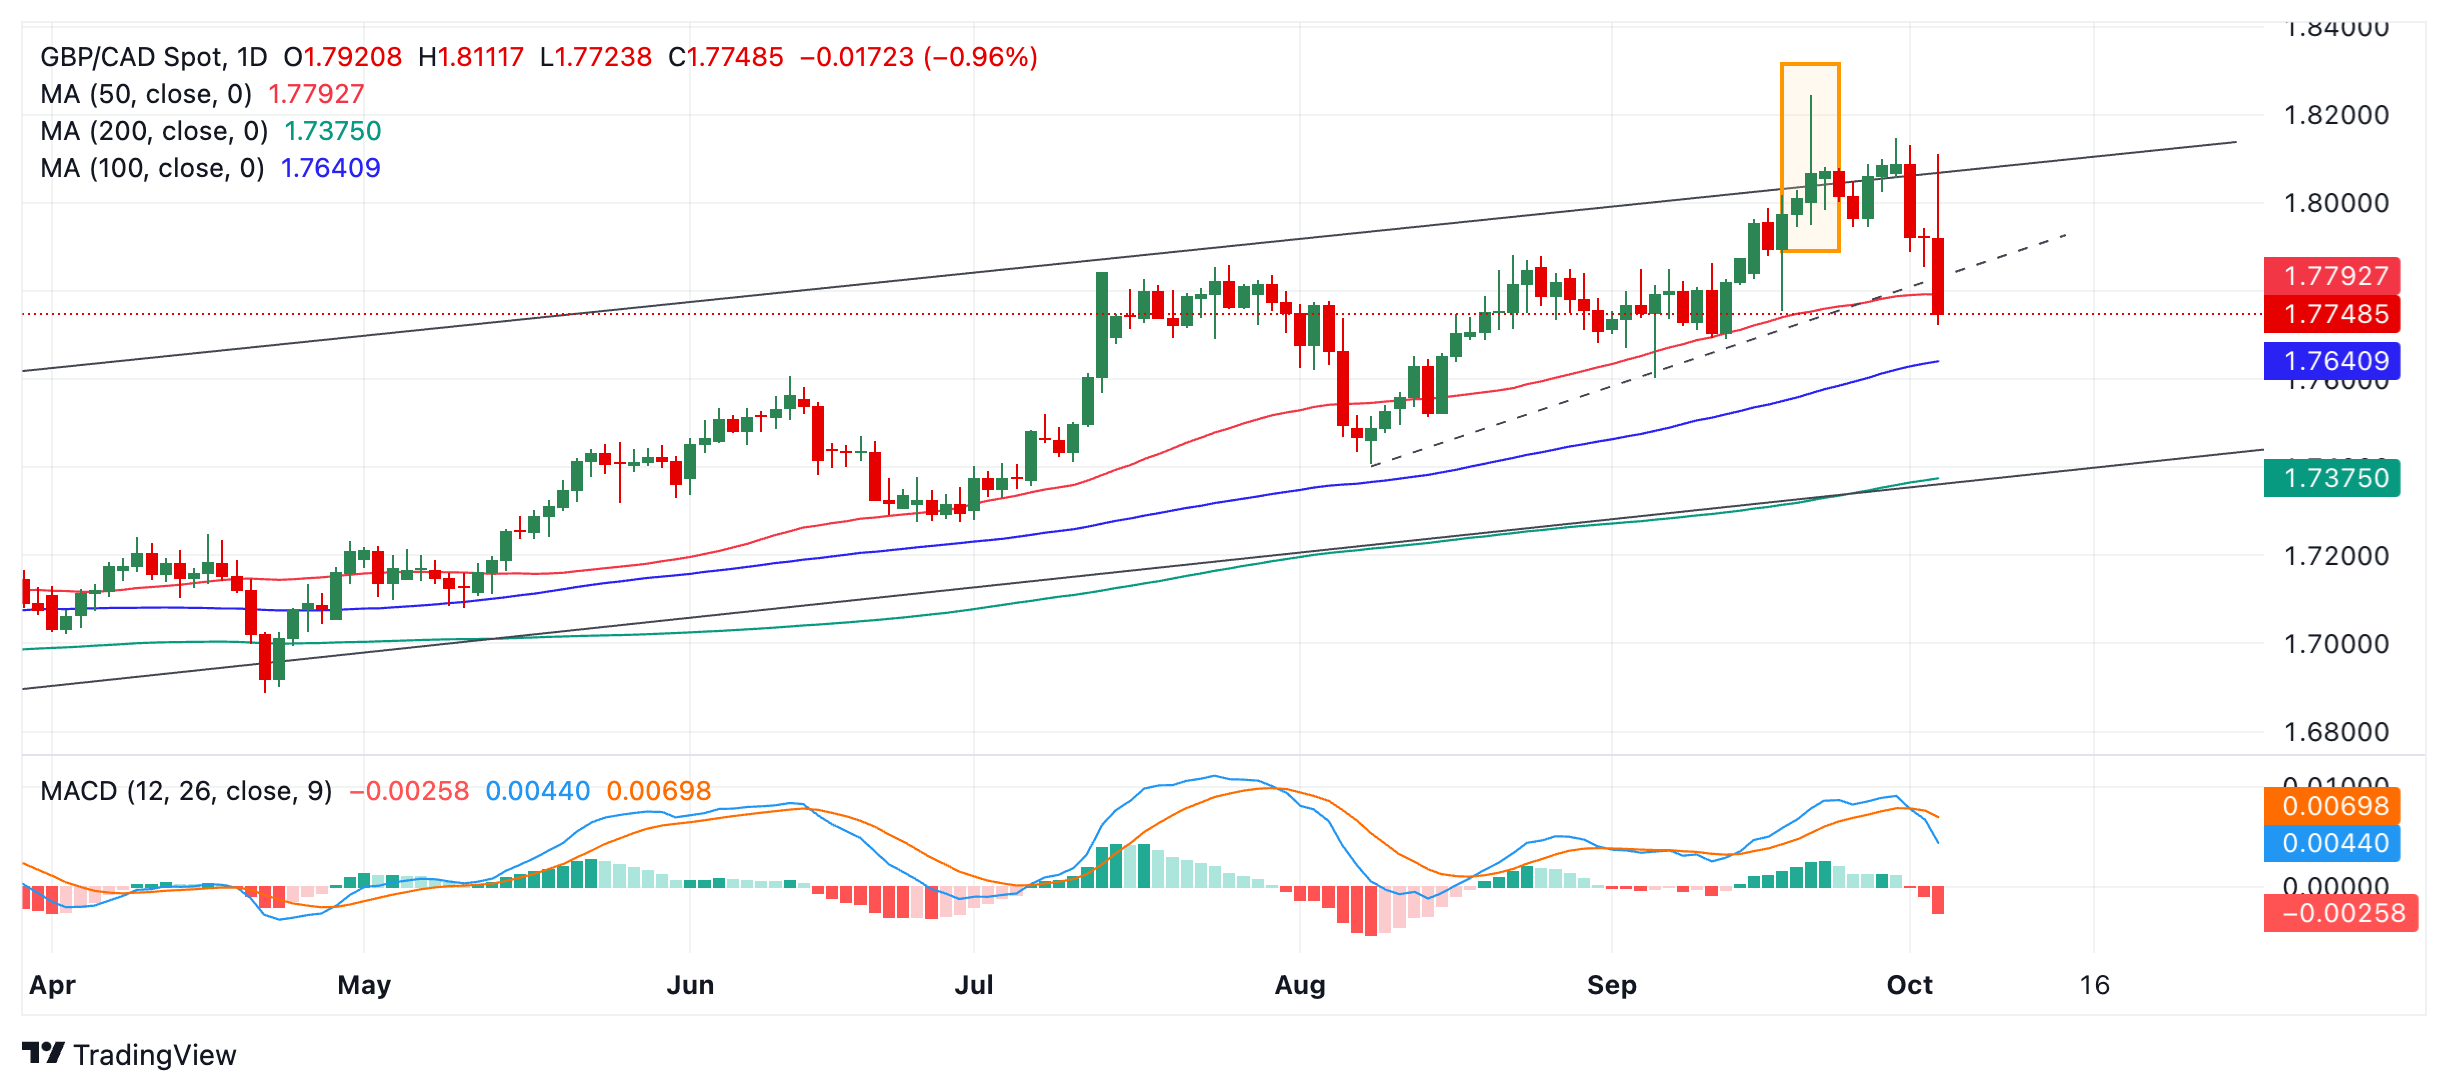
Subsequent downside targets lie at 1.7603 (September 4 low) and 1.7407 (August 8 low). In the most bearish scenario, the price could fall to the lower channel line at 1.7375. 

GBP/CAD is in an uptrend on the medium and long-term timeframes, as it oscillates higher within an ascending channel. There is a risk, therefore, of a reversal higher occurring unless the current sell-off marks the beginning of a deeper downtrend. This is possible, given its steepness. 

The Moving Average Divergence Convergence (MACD) has crossed below its signal line, providing added evidence that prices are going to push lower. 

The first signs of weakness came when the pair tested the upper channel line and formed a bearish Shooting Star Japanese candlestick reversal pattern on September 20 (orange rectangle on chart above). It then consolidated for a while before starting to fall properly on Tuesday.

Author

Joaquin Monfort

Joaquin Monfort is a financial writer and analyst with over 10 years experience writing about financial markets and alt data. He holds a degree in Anthropology from London University and a Diploma in Technical analysis.

More from Joaquin Monfort
Share:

Markets move fast. We move first.

Orange Juice Newsletter brings you expert driven insights - not headlines. Every day on your inbox.

By subscribing you agree to our Terms and conditions.

Editor's Picks

EUR/USD clings to small gains near 1.1750

Following a short-lasting correction in the early European session, EUR/USD regains its traction and clings to moderate gains at around 1.1750 on Monday. Nevertheless, the pair's volatility remains low, with investors awaiting this weeks key data releases from the US and the ECB policy announcements.

GBP/USD edges higher toward 1.3400 ahead of US data and BoE

GBP/USD reverses its direction and advances toward 1.3400 following a drop to the 1.3350 area earlier in the day. The US Dollar struggles to gather recovery momentum as markets await Tuesday's Nonfarm Payrolls data, while the Pound Sterling holds steady ahead of the BoE policy announcements later in the week.

Gold pulls away from session high, holds above $4,300

Gold loses its bullish momentum and retreats below $4,350 after testing this level earlier on Monday. XAU/USD, however, stays in positive territory as the US Dollar remains on the back foot on growing expectations for a dovish Fed policy outlook next year.

Solana consolidates as spot ETF inflows near $1 billion signal institutional dip-buying

Solana price hovers above $131 at the time of writing on Monday, nearing the upper boundary of a falling wedge pattern, awaiting a decisive breakout. On the institutional side, demand for spot Solana Exchange-Traded Funds remained firm, pushing total assets under management to nearly $1 billion since launch. 

Big week ends with big doubts

The S&P 500 continued to push higher yesterday as the US 2-year yield wavered around the 3.50% mark following a Federal Reserve (Fed) rate cut earlier this week that was ultimately perceived as not that hawkish after all. The cut is especially boosting the non-tech pockets of the market.

Solana Price Forecast: SOL consolidates as spot ETF inflows near $1 billion signal institutional dip-buying

Solana (SOL) price hovers above $131 at the time of writing on Monday, nearing the upper boundary of a falling wedge pattern, awaiting a decisive breakout.