|

Gartner Inc. (IT) Elliott Wave analysis: Wave IV correction targets key support zone

Gartner Inc. enters a corrective wave IV, targeting key Fibonacci support before resuming its bullish Elliott Wave V trend.

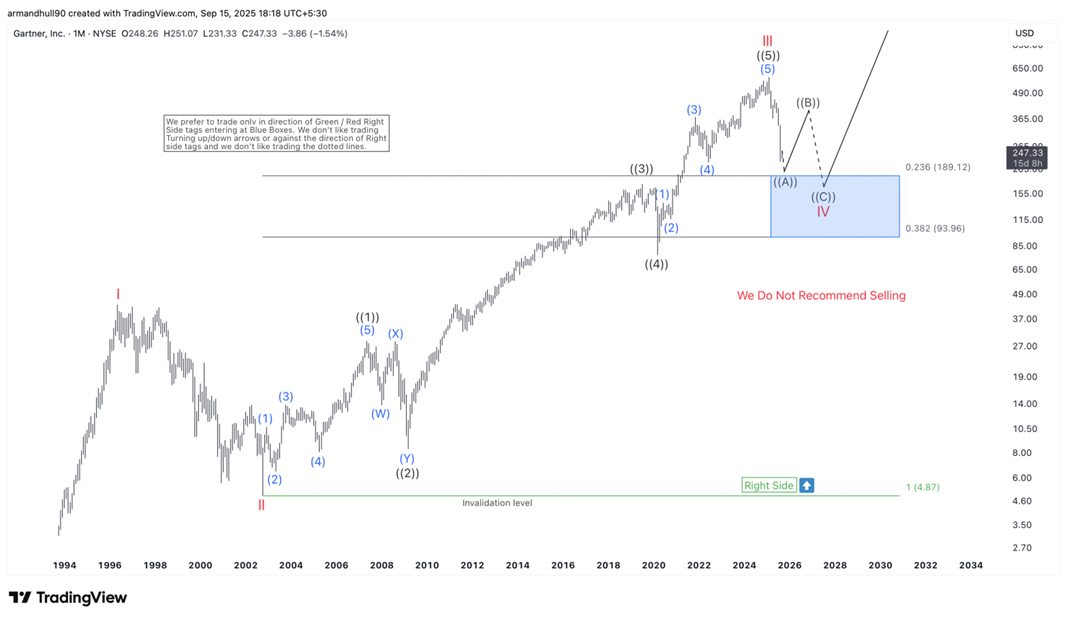
Gartner Inc. (NYSE: IT) has delivered an impressive multi-decade bullish cycle, advancing from the lows near $5 in 2002 to above $700 before the current pullback. The Elliott Wave count suggests that the stock recently completed wave III of a higher-degree impulse and is now entering a corrective wave IV. This phase is expected to retrace part of the prior rally before the next bullish leg, wave V, resumes.

The ongoing correction appears to be unfolding as a three-wave structure, labeled ((A))-((B))-((C)) of wave IV. Prices have already broken lower from the peak, suggesting that wave ((A)) is in progress. After a potential bounce in wave ((B)), a final decline in wave ((C)) is expected, which should complete the larger degree wave IV.
Chart

Key Fibonacci retracement levels between $189.12 (23.6%) and $93.96 (38.2%) mark the ideal support area for wave IV. This zone is highlighted as the blue box on the chart, where buyers may step in for the next bullish cycle. According to Elliott Wave guidelines, wave IV expected to find support near the 23.6%–38.2% retracement of wave III, making this zone critical for investors to watch.

Author

Elliott Wave Forecast Team

Elliott Wave Forecast Team

ElliottWave-Forecast.com

More from Elliott Wave Forecast Team
Share:

Editor's Picks

GBP/USD surrenders some gains, back to 1.3420

GBP/USD holds on to moderate gains above 1.3400 the figure on Friday. Optimism surrounding the UK government’s leadership transition and expectations of further BoE tightening support the British Pound, while easing tensions in the Middle East and fading Fed rate-hike expectations weigh on the US Dollar.

EUR/USD turns positive, targets 1.1450

EUR/USD now picks up pace and advances toward the 1.1440 region on Friday, up modestly for the day. With no major economic data due, lingering uncertainty over the US-Iran conflict keeps investors cautious, limiting the pair's upside.

Gold remains offered, still below $4,100

Gold struggles to extend Thursday’s rebound and navigates below the $4,100 mark per troy ounce on Friday. Uncertainty surrounding the Middle East conflict limits the precious metal’s upside, which is also under pressure amid rising US Treasury yields across the curve.

Week ahead – US CPI and Warsh testimony to take centre stage, BoC eyed too

US inflation report and Warsh testimony to headline the week. Dollar to dominate amid slew of other US data and Mideast tensions. Amid fresh Iran escalation, China GDP to shed light on Q2 impact. Bank of Canada not expected to follow RBNZ with rate hike.

Five sessions, one round trip: Why the whipsaw is exactly what Warsh ordered

Markets opened July with a December hike as the base case and spent five trading sessions unlearning and relearning it. A 57K payrolls print bled the tightening bets out of the strip; a re-shut Strait of Hormuz is pushing them back in. Wednesday's minutes from the June Federal Open Market Committee meeting landed mid-round-trip, describing a world that had already stopped existing.

Five sessions, one round trip: Why the whipsaw is exactly what Warsh ordered

Markets opened July with a December hike as the base case and spent five trading sessions unlearning and relearning it. A 57K payrolls print bled the tightening bets out of the strip; a re-shut Strait of Hormuz is pushing them back in. Wednesday's minutes from the June FOMC meeting landed mid-round-trip, describing a world that had already stopped existing.