GameStop Stock Price and Forecast: GME corrects 14% from three-week highs
- GameStop plunged on Tuesday as Wall Street suffers a tech sell-off.
- GME trims Monday's gains and turned red for the week.
- Social media mentions for the gaming company are rising in line with the GME stock price.

Update, November 24: GameStop staged a massive correction from three-week highs of $252.20 on Tuesday, reversing almost the two-day surge. In doing so, GME stock price tumbled 13.59% on the day, settling at $213.90. The sharp correction doesn’t come as a surprise, especially after the stock has soared nearly 43% in October. Investors believe that the stock looks overbought, which could be the catalyst behind the latest sell-off. Meanwhile, mixed sentiment on Wall Street overnight also dented the investors’ appetite towards the meme stock.
GameStop has seen some renewed activity as the stock surged over 8% on Monday. This followed on from a gain of nearly 9% on Friday as momentum in the name began to pick up. There is no real underlying news flow on this one – does there need to be?
-637732698421915372.png)
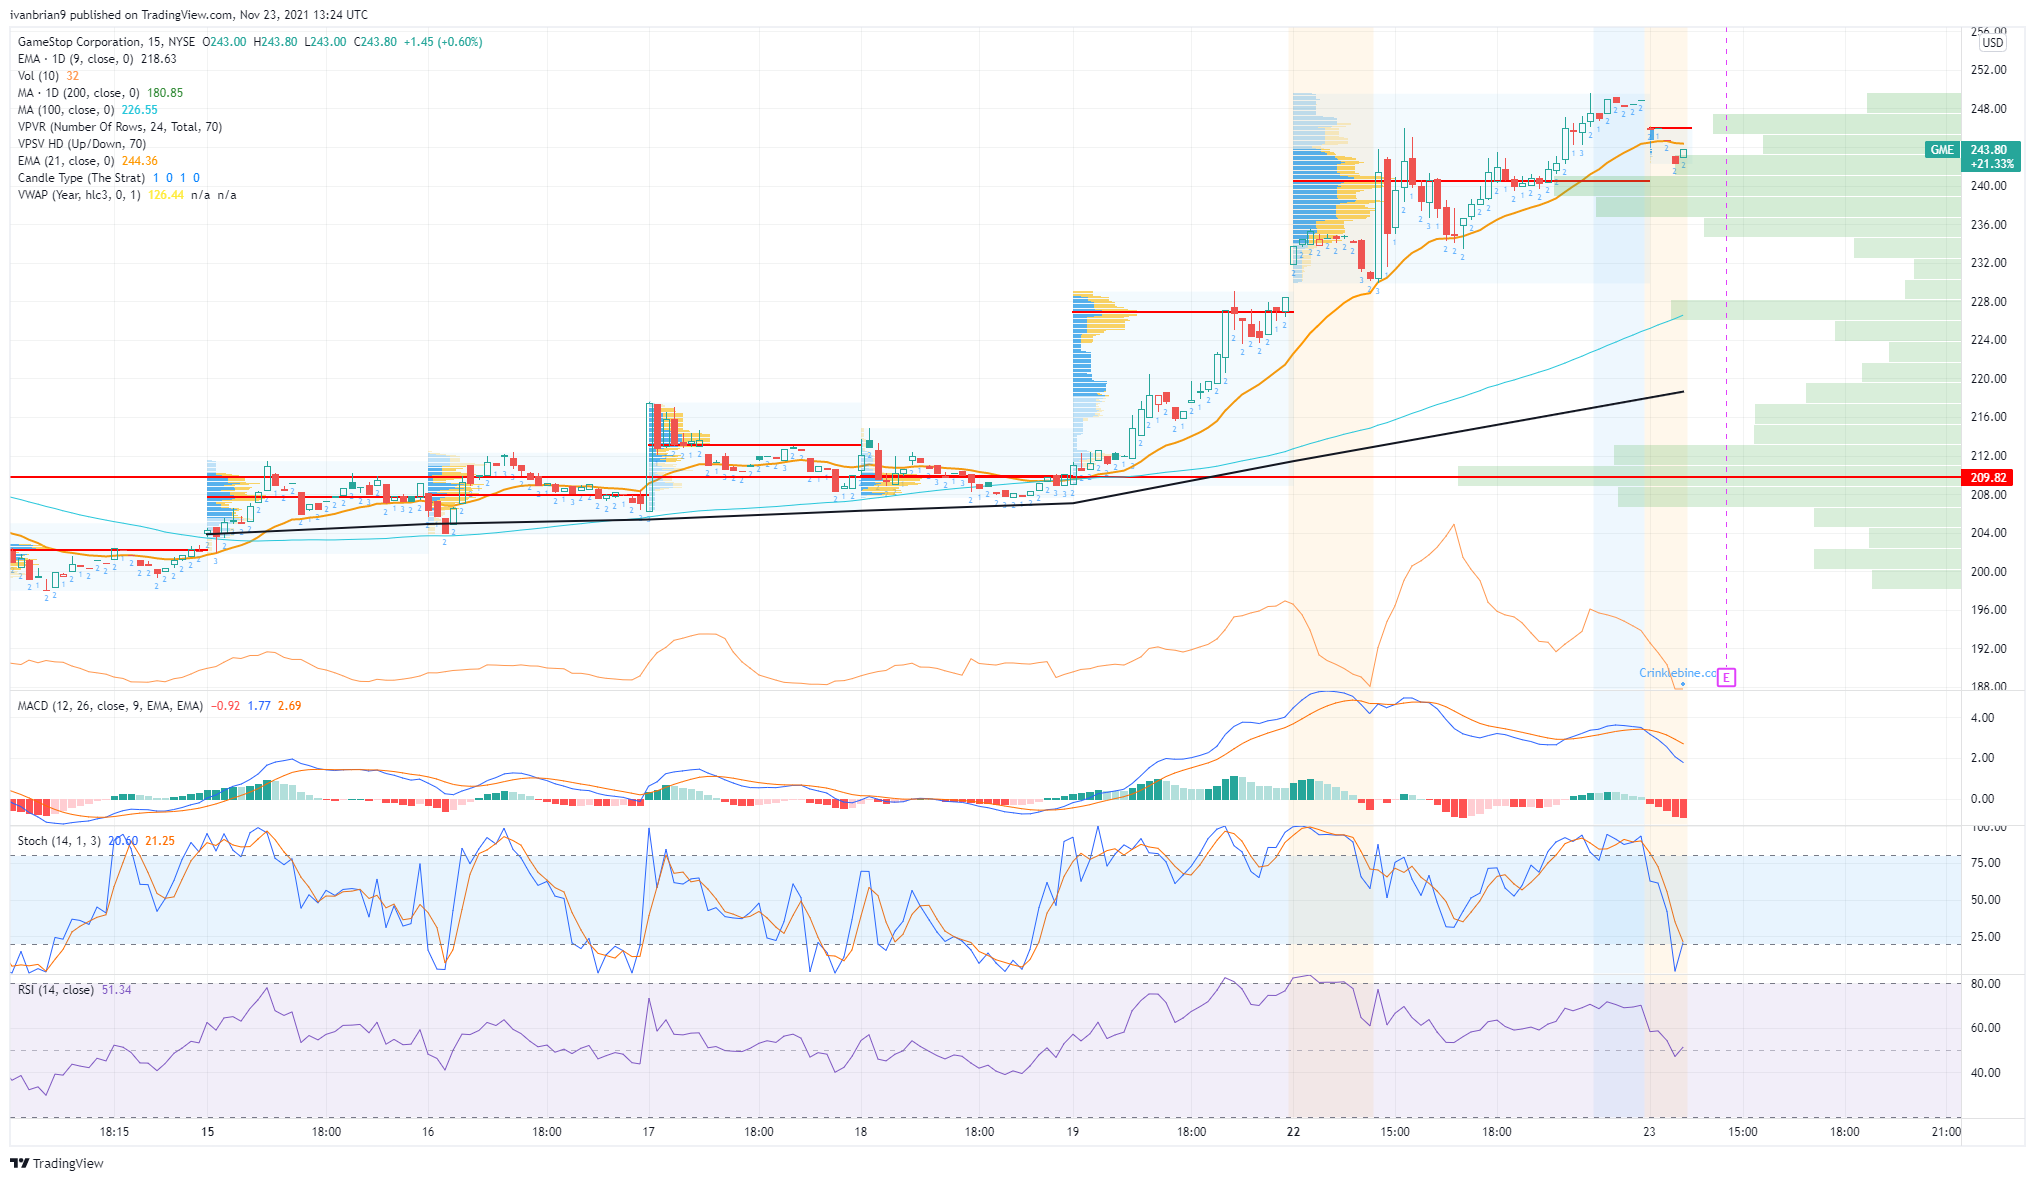
GameStop (GME) graph, 15-minute
We can see from our chart above that the Gamestop rally is once again gathering steam. The stock is now nearly up 20% in the last week. Not bad, but actually for a meme stock that makes it pretty calm! The key question is can GME hold this momentum or is it going to fade away again in line with more recent trends in the stock.
GameStop (GME) stock news
Now we said there was no real fundamental news behind the recent move, but in a bizarre twist, there may be. One of 13 original copies of the US Constitution was recently up for auction and a crypto group called Constitution DAO has pledged funds together in order to bid on it. This group failed, and it appears this has emboldened investors to return to bidding up GameStop instead. This is one of the stranger reasons we have reported on for a stock surge in my experience, but then 2021 has provided many unique investment reasons.
Sentiment has been rising with SocialSentiment.io showing a spike in recent days.
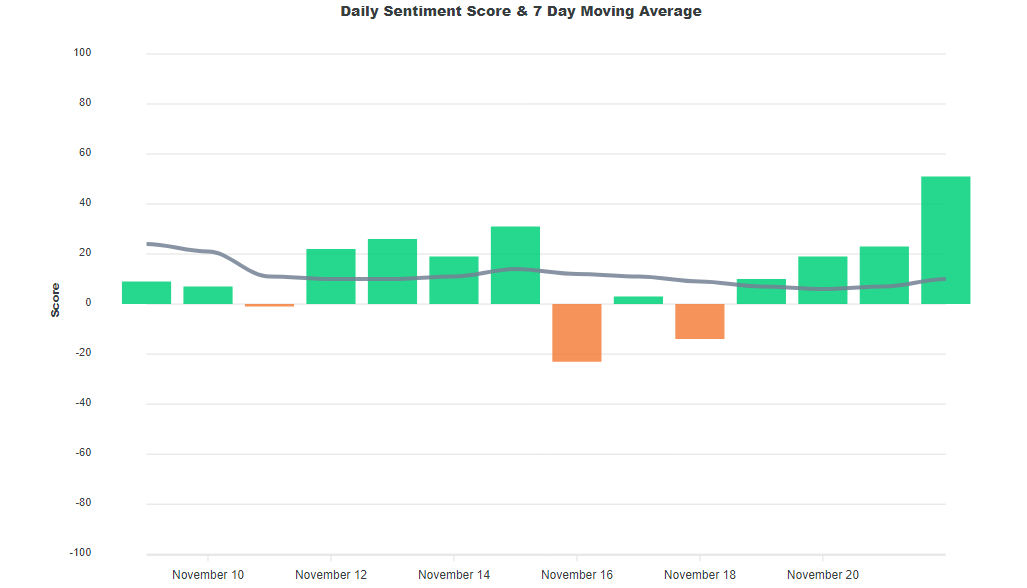
Source: SocialSentiment.io
GameStop (GME) stock forecast
In the shorter term, the move is held by support at $234 as we can see from the 15-minute GME chart below. Once under $234, there is a large volume gap until $213, so any break could accelerate.
The daily chart does not really give too many clues. GME has been relatively calm of late just like its little brother AMC. The crowd moved onto the EV stocks such as Rivian (RIVN) and Canoo (GOEV) as the volatility waned, and so the opportunity there was greater. Breaking resistance at $255 may get GME going again, but we feel it will be back to $220. This one is likely to slide in the coming days. Momentum is due to tail off as Thanksgiving approaches, and GME is the king of momentum stocks.
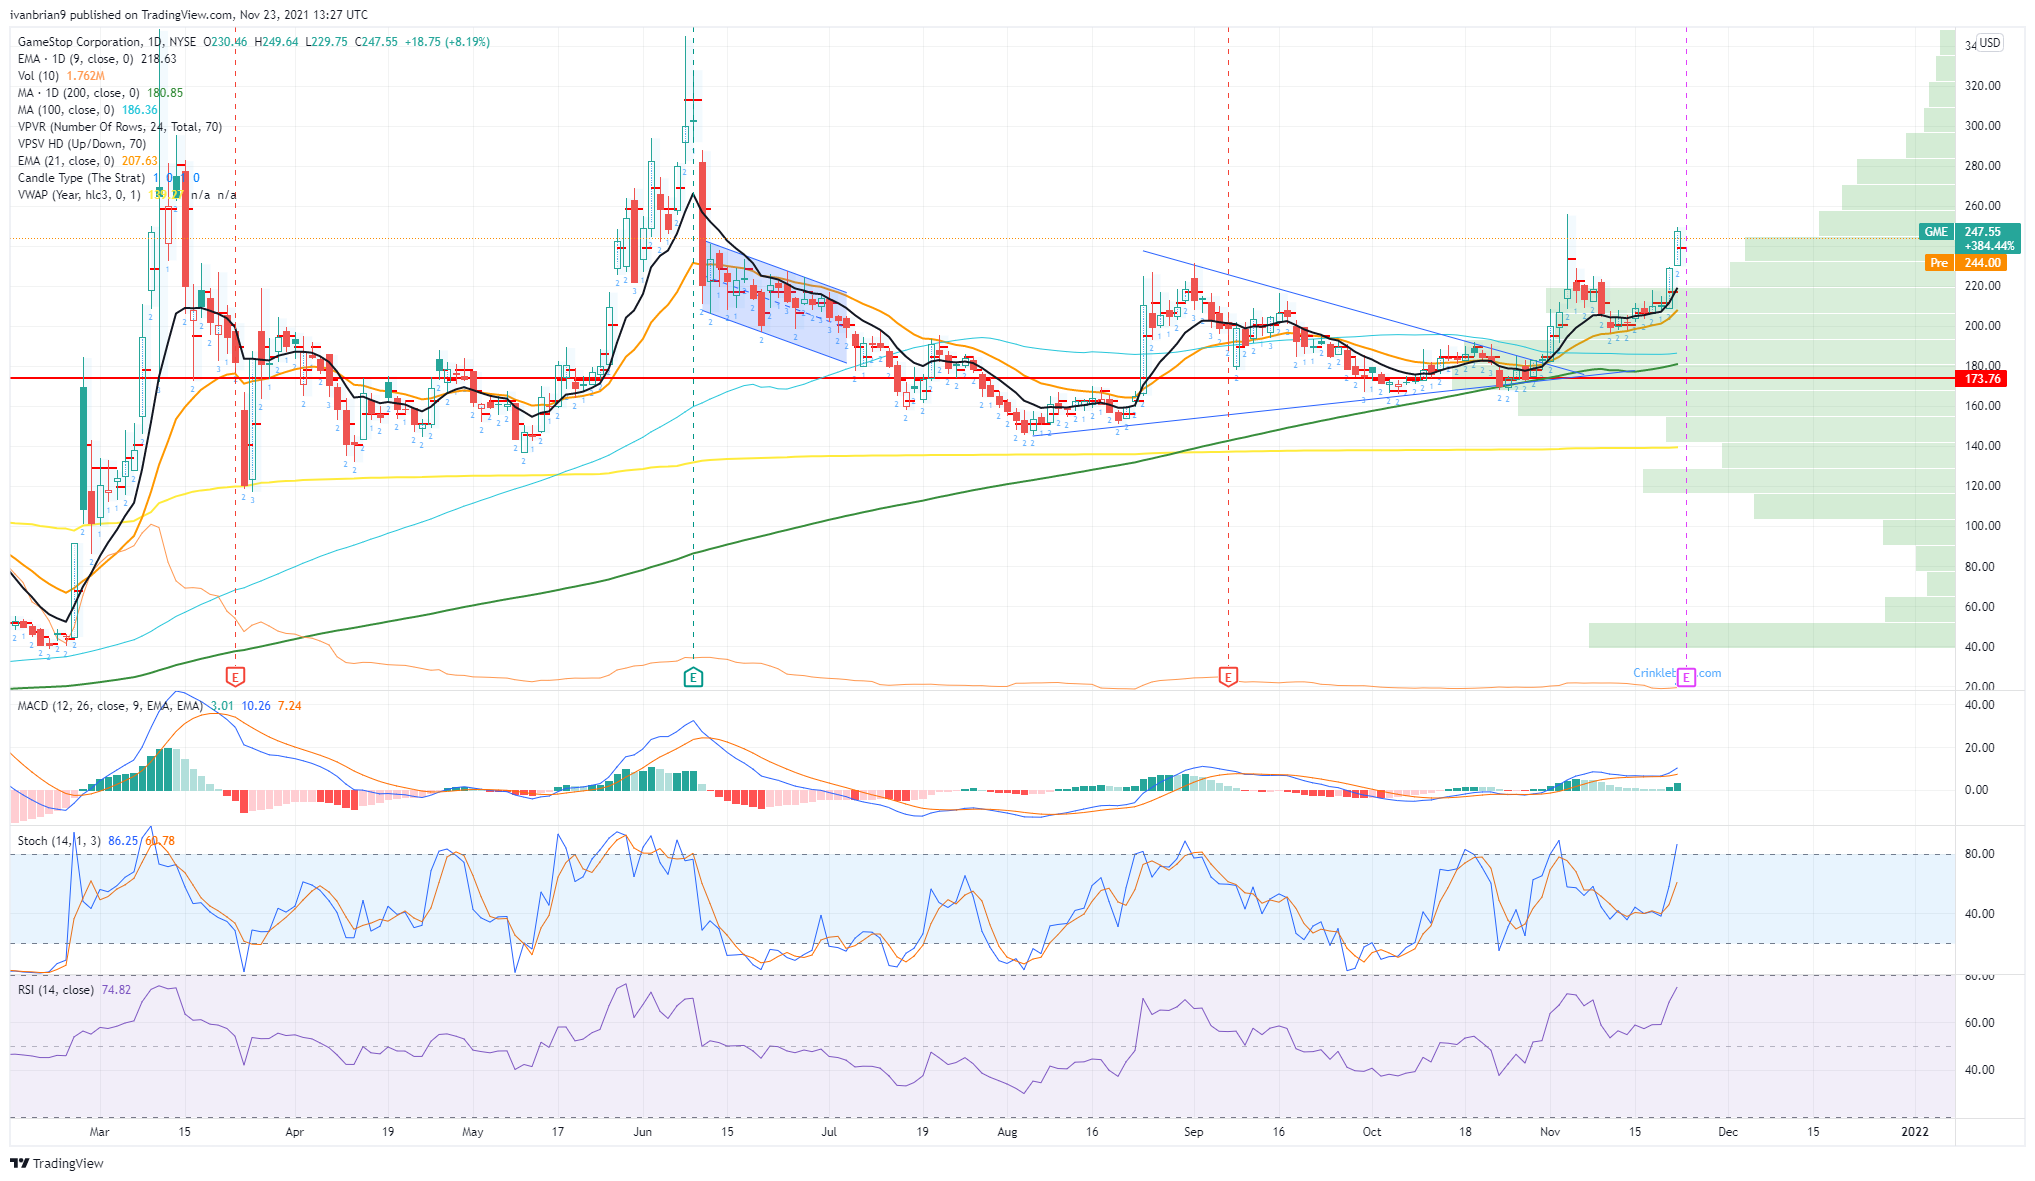
GME daily chart
Previous updates
Update: GameStop trades at $218.00 per share, down roughly 12%. Wall Street spent most of the day in the red, although major indexes bounced ahead of the close. Only the Nasdaq Composite remains in the red, as the tech sector was the worst performer. As for the NYSE, it's currently up 50 points, while the DJIA is the best performer, adding 165 points or 0.47%. Market participants await US inflation and growth-related data to be out on Wednesday, rushing into safety ahead of it.
Update: Despite driving up above $249 at the open on Tuesday, GME shares are down 6% to $232.09 on Tuesday.
Premium
You have reached your limit of 3 free articles for this month.
Start your subscription and get access to all our original articles.
Author

Ivan Brian
FXStreet
Ivan Brian started his career with AIB Bank in corporate finance and then worked for seven years at Baxter. He started as a macro analyst before becoming Head of Research and then CFO.


