|premium|

FXE Stock Elliott Wave and long term cycles

Firstly as seen on the monthly chart shown below the instrument made a high in April 2008. There is data back to December 2005 in the ETF fund. Data correlated in the EURUSD foreign exchange pair suggests the high in April 2008 was the end of a cycle up from the all-time lows. EURUSD data shows the pair had a five-wave-up move from the early 1970’s era. This data is derived from the German Mark currency against the US Dollar that preceded the inception of the Euro currency.

As you can see the FXE instrument reflects the price swings of the single currency well. As previously mentioned the instrument made a high in April 2008. This where the analysis begins on the monthly chart shown below. The correction from those highs appears to be an Elliott Wave zig-zag structure correction. The analysis continues below the monthly chart.

FXE

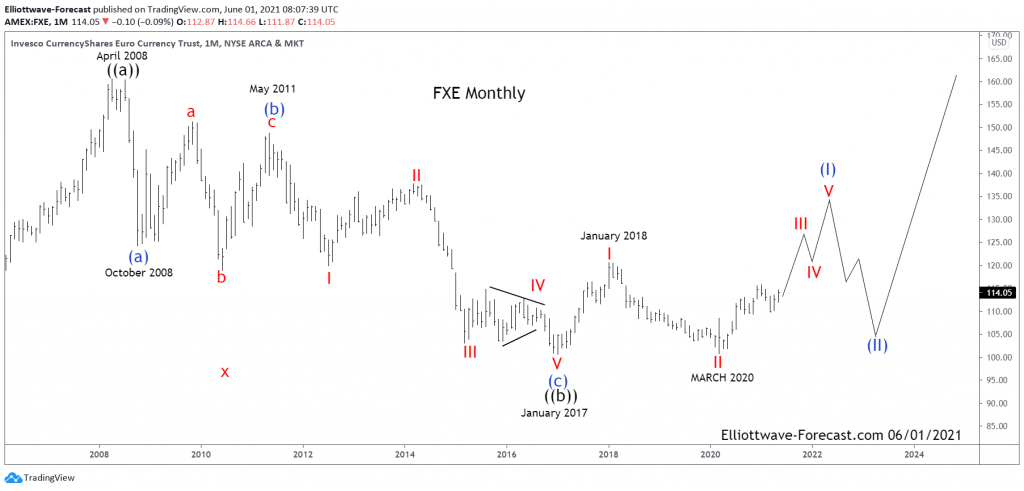
Secondly as mentioned the decline from the April 2008 highs appears to be an Elliott Wave zig-zag structure. This structure is also called a 5-3-5 in Elliott Wave terms. When a cycle ends against a trend it will show up in momentum indicators usually before price makes it obvious. Further, these cycle lows and highs are in the blue color as shown on the chart above (a)-(b)-(c). This finished ((b)) in January 2017.

Lastly and in conclusion. The instrument ended a cycle lower from the January 2018 highs in March of 2020. It can further bounce higher toward the 130.00 to 135.00 area while above the March 31st, 2021 lows. It should reach that area before it corrects the cycle up from the January 2017 lows. 

Premium

You have reached your limit of 3 free articles for this month.

Start your subscription and get access to all our original articles.

Subscribe to PremiumSign In

Author

Elliott Wave Forecast Team

Elliott Wave Forecast Team

ElliottWave-Forecast.com

More from Elliott Wave Forecast Team
Share:

Editor's Picks

EUR/USD flirts with daily highs, retargets 1.1900

EUR/USD regains upside traction, returning to the 1.1880 zone and refocusing its attention to the key 1.1900 barrier. The pair’s slight gains comes against the backdrop of a humble decline in the US Dollar as investors continue to assess the latest US CPI readings and the potential Fed’s rate path.

GBP/USD remains well bid around 1.3650

GBP/USD maintains its upside momentum in place, hovering around daily highs near 1.3650 and setting aside part of the recent three-day drop. Cable’s improved sentiment comes on the back of the Greenback’s  irresolute price action, while recent hawkish comments from the BoE’s Pill also collaborate with the uptick.

Gold clings to gains just above $5,000/oz

Gold is reclaiming part of the ground lost on Wednesday’s marked decline, as bargain-hunters keep piling up and lifting prices past the key $5,000 per troy ounce. The precious metal’s move higher is also underpinned by the slight pullback in the US Dollar and declining US Treasury yields across the curve.

Crypto Today: Bitcoin, Ethereum, XRP in choppy price action, weighed down by falling institutional interest 

Bitcoin's upside remains largely constrained amid weak technicals and declining institutional interest. Ethereum trades sideways above $1,900 support with the upside capped below $2,000 amid ETF outflows.

Week ahead – Data blitz, Fed Minutes and RBNZ decision in the spotlight

US GDP and PCE inflation are main highlights, plus the Fed minutes. UK and Japan have busy calendars too with focus on CPI. Flash PMIs for February will also be doing the rounds. RBNZ meets, is unlikely to follow RBA’s hawkish path.

Ripple Price Forecast: XRP potential bottom could be in sight

Ripple edges up above the intraday low of $1.35 at the time of writing on Friday amid mixed price actions across the crypto market. The remittance token failed to hold support at $1.40 the previous day, reflecting risk-off sentiment amid a decline in retail and institutional sentiment.