FuelCell Energy Stock Price and Forecast: Is FCEL stock fuelling up for another move higher?
- FuelCell Energy is stable on Thursday, closing down 0.25%.
- FCEL stock ignited earlier this week with an 18% surge.
- FuelCell winning new retail trading fans, but can the rally continue?

FuelCell Energy (FCEL) shares were pretty quiet on Thursday in a bit of a change for the latest hot retail stock. The name had popped on Monday as heavy social media chatter had seen increased interest among retail traders. The stock duly took off and gained 18% on Monday. Nothing like momentum to draw in some new buyers, but FCEL stock has struggled since then. It has since posted three red days in a row. Crucially from a technical view though, it has held up reasonably well and not traded lower than Monday's low.
The move in FCEL did stagger a bit mid-week when news broke that the clean energy provision of the massive stimulus bill may not make it through the Senate. It was being reported that Senator Joe Manchin was not going to support the bill. Clean energy stocks did wobble a bit on the news, and FuelCell certainly is in this sector. Mentions on social media as we can see below from the Refinitiv social media monitor continue to fall. This is in line with the share price fall. Given FCEL is a retail momentum name, it needs to stay in the limelight, so we take this as a bearish sign.
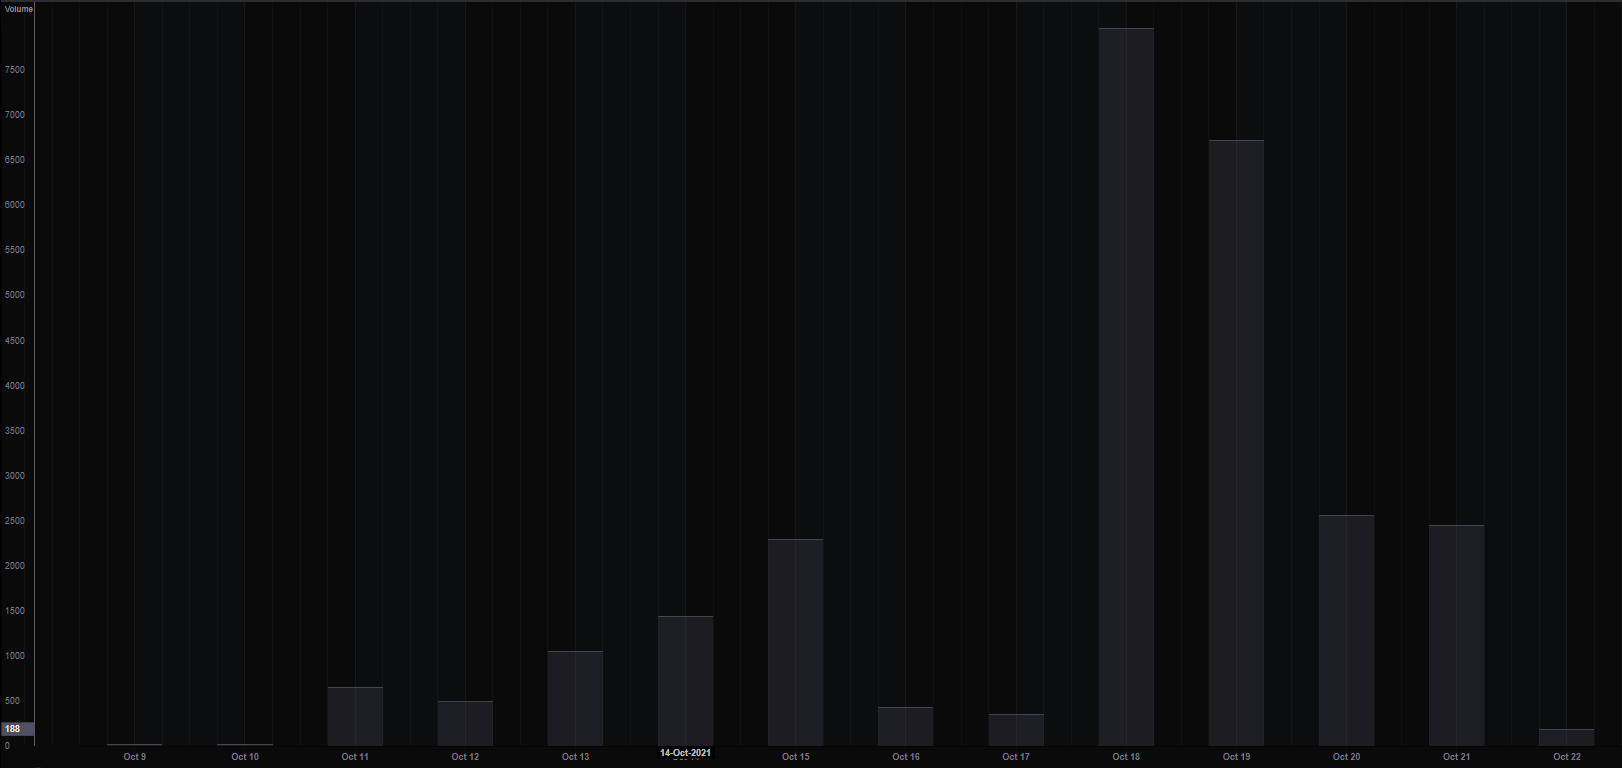
Source: Refinitiv
FuelCell (FCEL) stock forecast
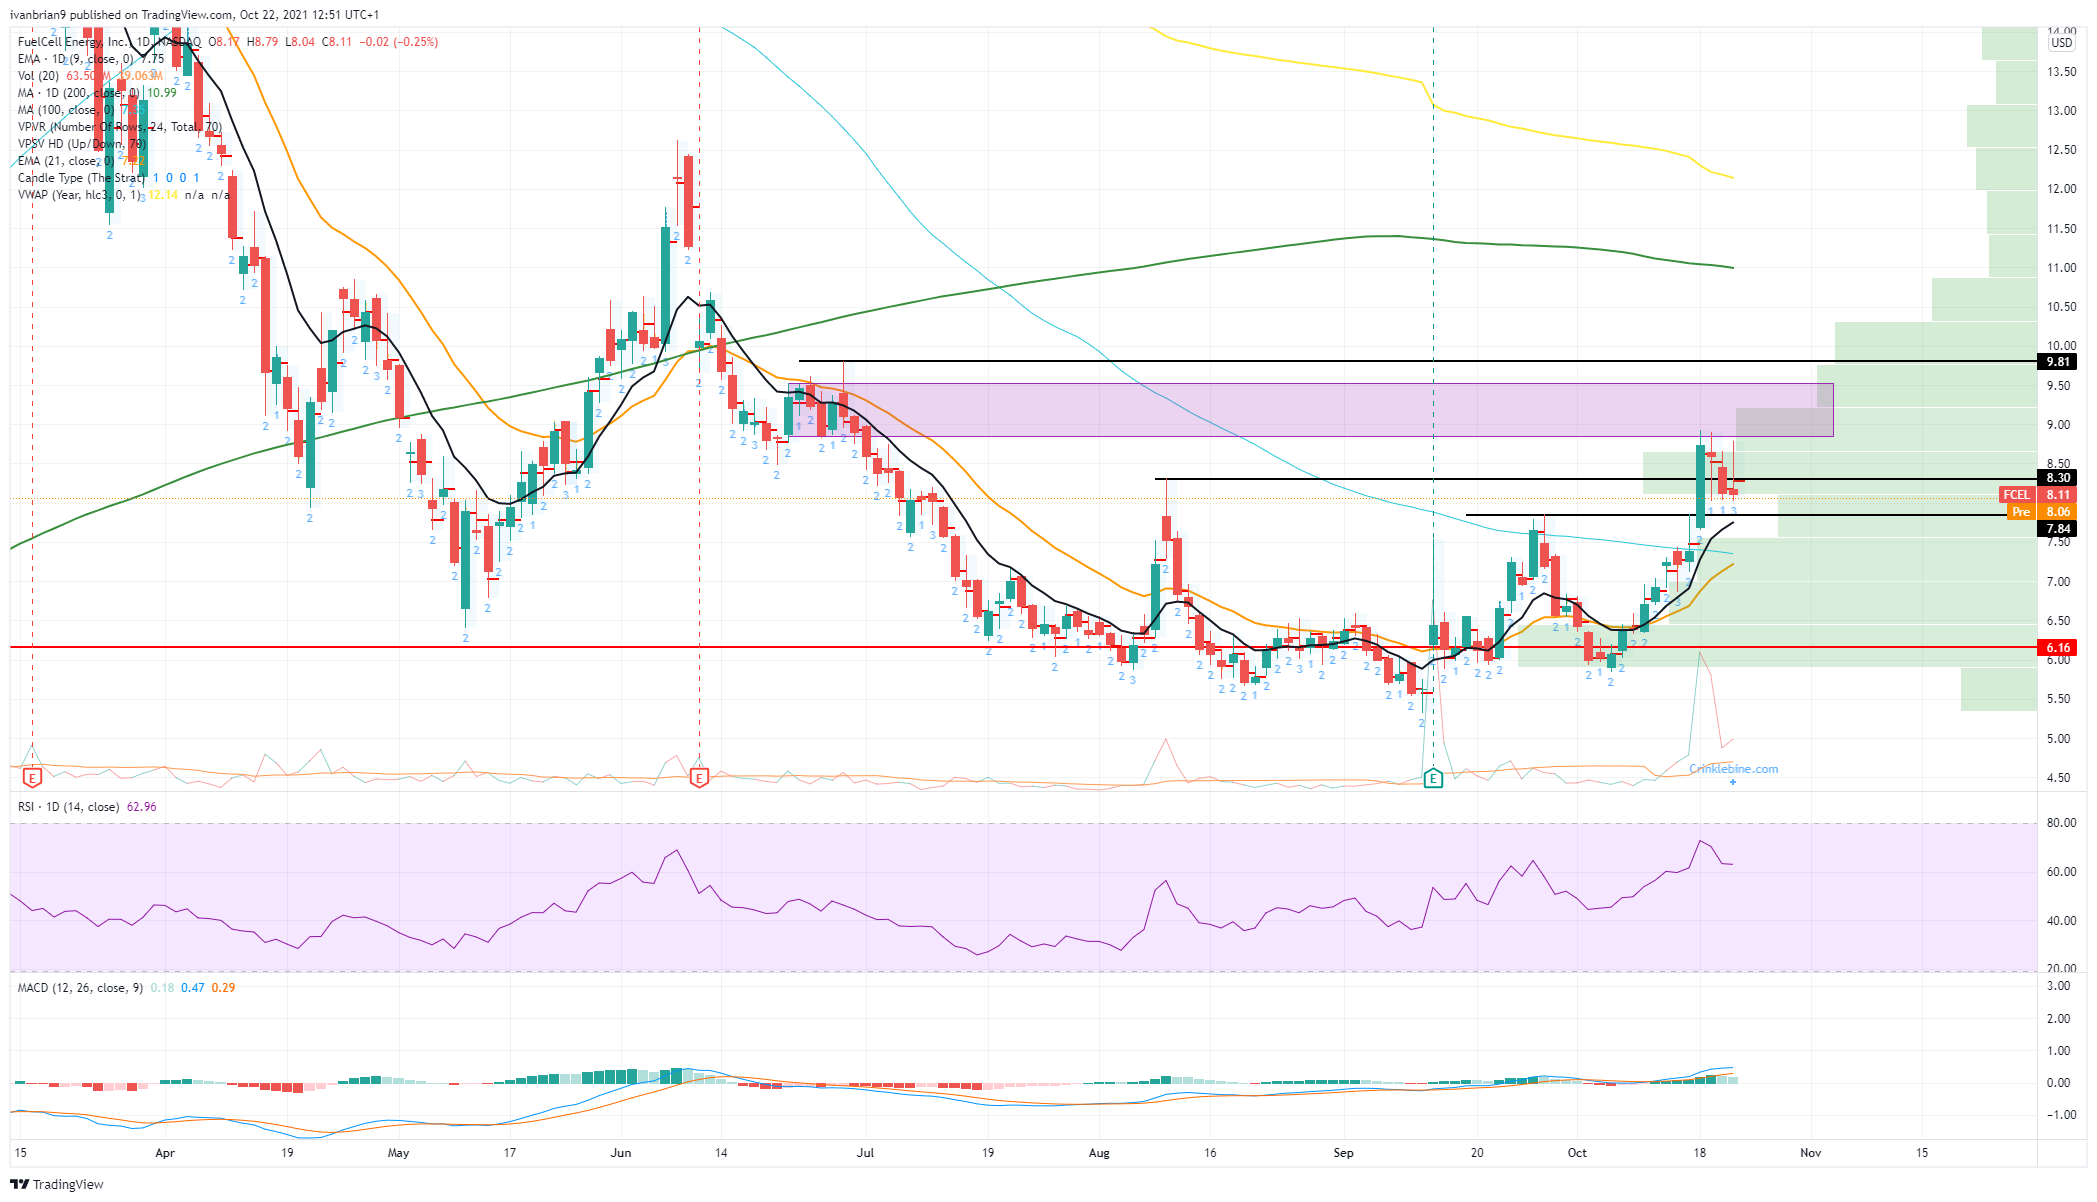
The strong spike on Monday topped out at our resistance zone (highlighted). This is the consolidation phase from back in June. This stopped the losses in FCEL share price for a time before moving lower again. There is clearly some supply at this level, making it a source of resistance. FCEL stock though has held above $8, and that is a key level. Not only is it a nice, even, round number, but now it is helping with the formation of a flag pattern. The strong move followed by the consolidation forms a bull flag pattern. Given that we call it a bull flag pattern, you can guess then that it is bullish.
Rather, it is bullish so long as the bottom of the flag holds as support. This is at $8. Breaking below will end the bullish trend in our view. If it holds, consolidates and manages to break higher, then this old consolidation zone around $9 to $9.50 will serve as resistance. Once above $10.50, things really thin out in terms of volume, so gains would then be easier to sustain. Breaking the flag would bring support from the 100-day moving average into play at $7.35 and then $6.16, which is a high volume zone and the point of control.
Premium
You have reached your limit of 3 free articles for this month.
Start your subscription and get access to all our original articles.
Author

Ivan Brian
FXStreet
Ivan Brian started his career with AIB Bank in corporate finance and then worked for seven years at Baxter. He started as a macro analyst before becoming Head of Research and then CFO.


