FuboTV Stock Earnings and Forecast: FUBO advances on Q3 earnings beat


  • FUBO jumped more than 4% on Q3 results.
  • FuboTV offered up a beat on top and bottom lines.
  • FUBO stock is down 90% over the past year.

FuboTV (FUBO), the company that bills itself as the Netflix of live sports, saw its share price rise in Friday's premarket after the New York-based company reported earnings that beat consensus on the top and bottom lines. FUBO stock has risen 4.7% to $3.55.

FuboTV earnings news

Fubo reported Q3 adjusted earnings per share (EPS) of $-0.52, which was about 10 cents ahead of the average forecast from Wall Street. Likewise, revenue of $225 million beat consensus of $213 million. 

Guidance for the fourth quarter was rather conservative, however. Management said that revenue would arrive between $227.5 million and $282.5 million – an unusually wide range. The midpoint here – $250 million – was well under the prior consensus from analysts of just above $275 million. The company also said it expected to have about 1.365 million subscribers by the end of the year.

The market is likely mostly enthused by the fact that while much of the pandemic's top growth stocks are seeing hefty sales growth percentages fall by the wayside, FuboTV still grew sales by just under 44% YoY in the third quarter.

“Revenue and subscriber growth for our global streaming business was solid with North American subscribers reaching a record high of 1,231,000," said CEO David Gandler in a statement. "As our premium offering continues to drive an ever greater number of consumers to our platform, our differentiated product experience and broad content portfolio keep them engaged - with this quarter representing an all-time low for subscriber churn."

Gandler especially focused on the 10 percentage point drop in adjusted EBITDA Margin to -41.2%. Of course, that still looks quite poor as a snapshot, but at least it is an improvement. Also, it distracts from the fact that total operating expenses grew at about the same rate as revenue and that the net loss grew by 44% YoY.

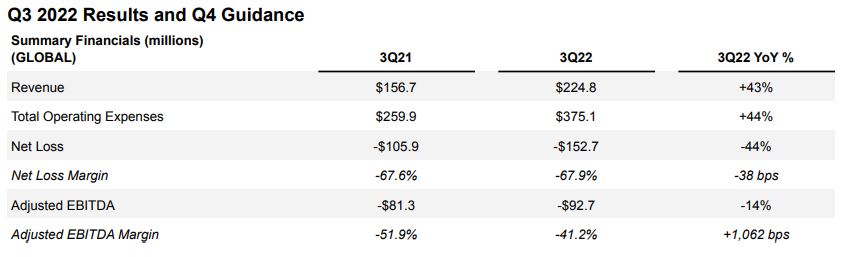
Source: Q3 Shareholder Letter

FuboTV stock forecast

The 8-week moving average is now pushing above the 30-week average – a positive sign. This was helped by the mid-August surge to $8.14, which dissipated rather abruptly. Despite being down 90% over the past year, however, FUBO stock has actually recovered on the Relative Strength Index (RSI) and is no longer in oversold territory. The market seems to be saying that it is now fairly priced. 
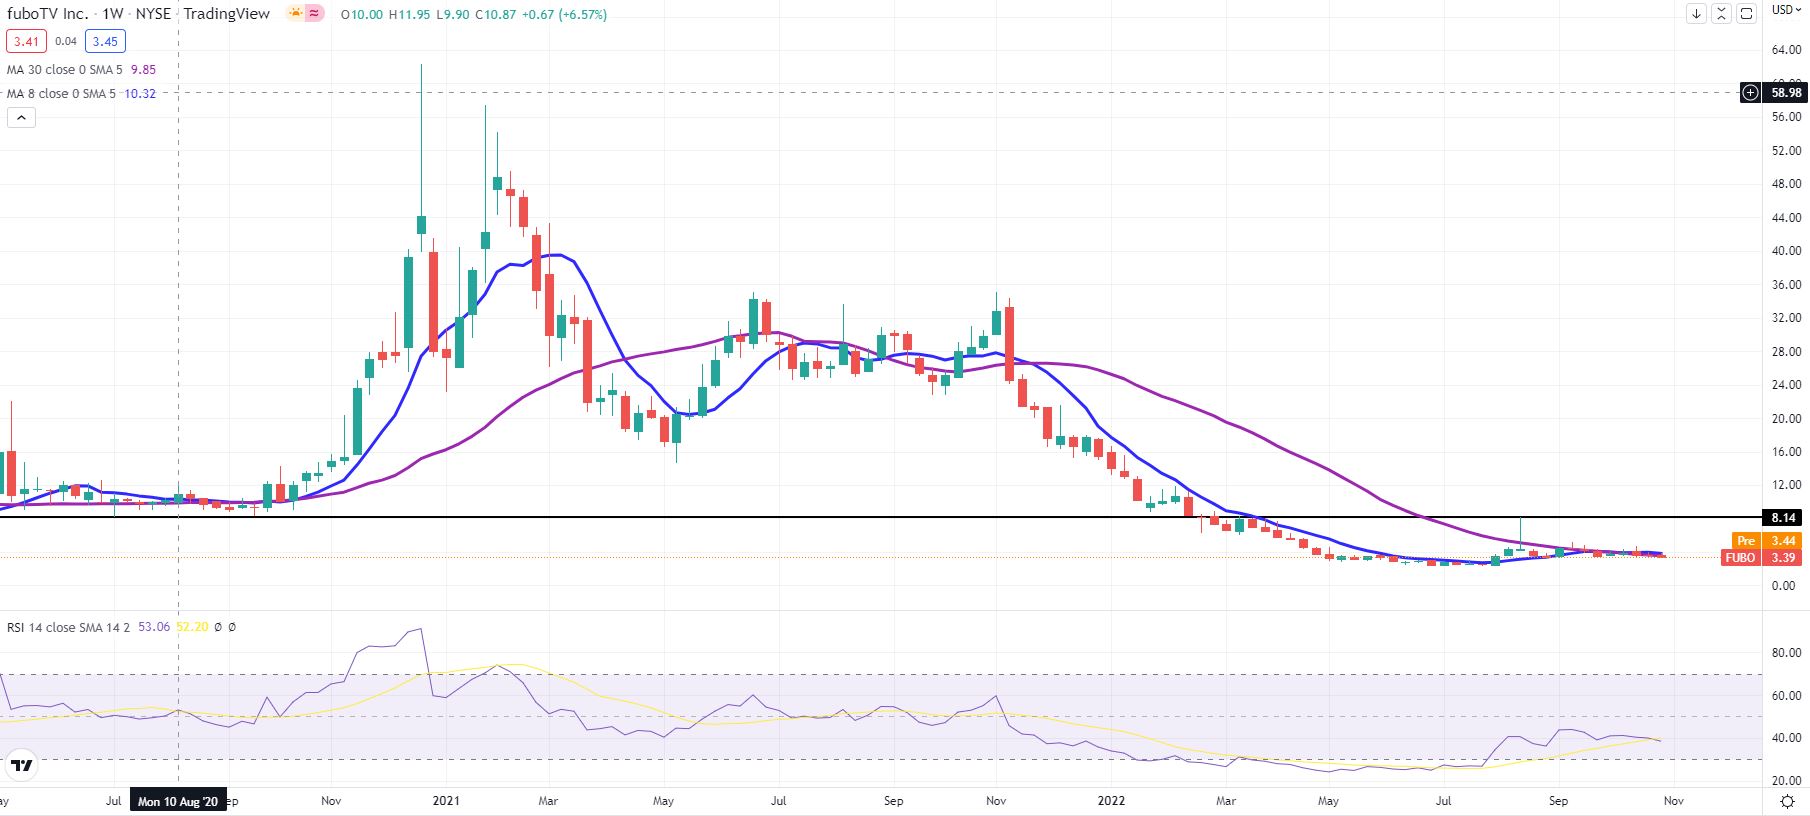
FUBO stock price has been trading muted in the past weeks

FUBO weekly chart

The daily chart below shows a number of recent lower highs, however. FUBO bulls have their work cut out for them. First, they need to conquer the October 18 high at $4.74. Then they have resistance from mid-September at $5.12. Supporters will need to focus on these two points of resistance before they can think about the longer-term high at $8.14.
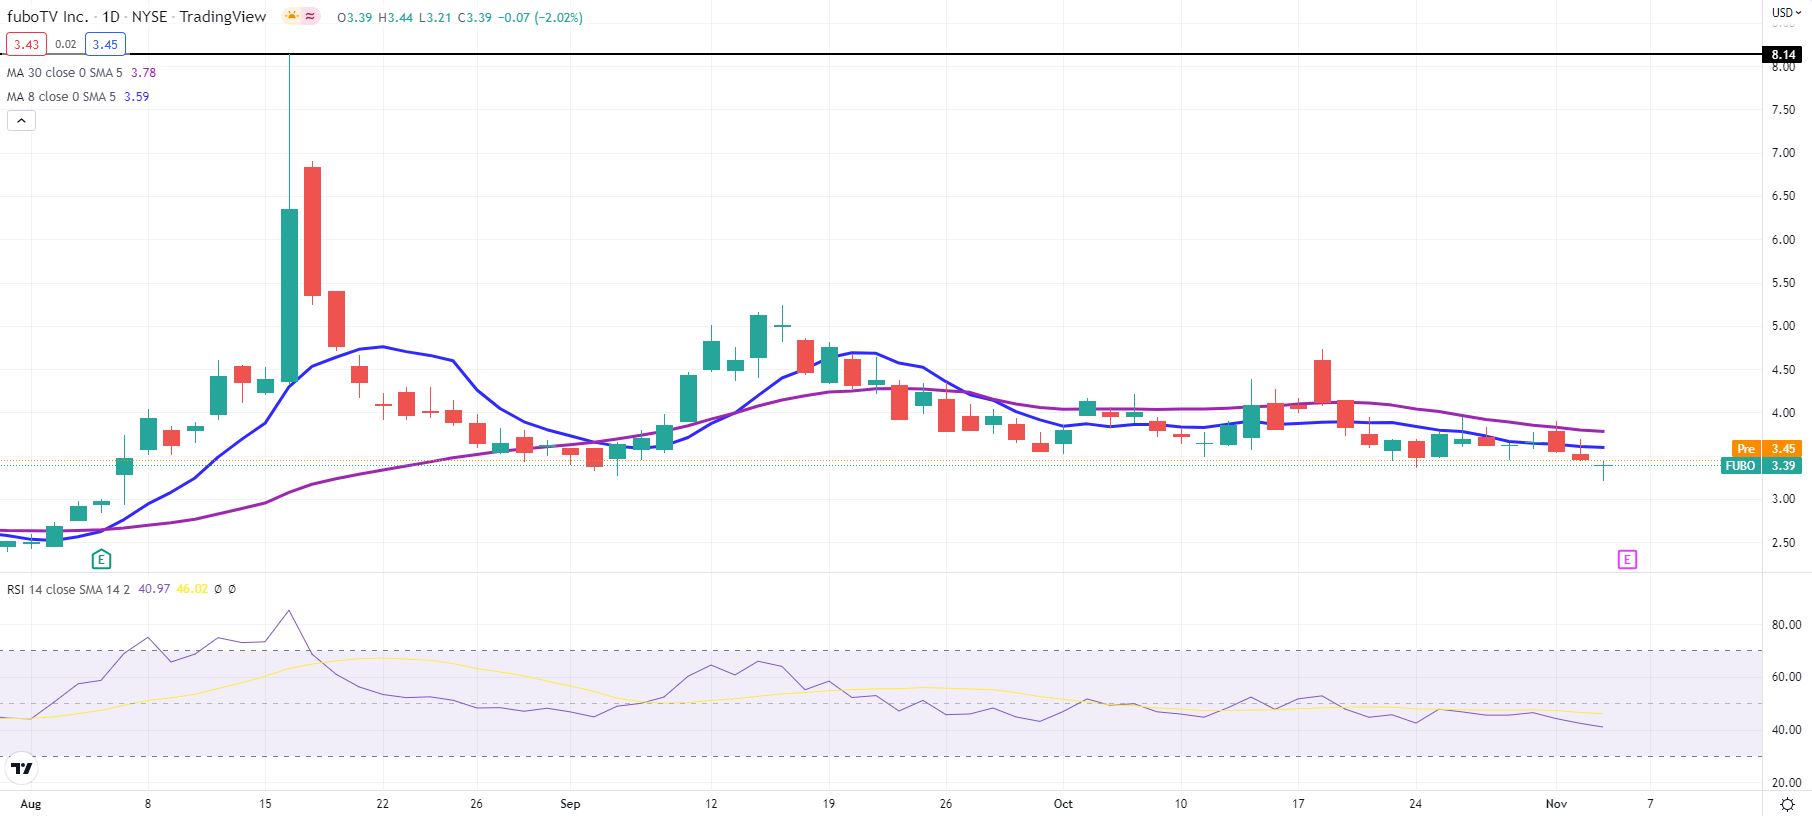
FUBO stock chart shows price below main moving averages

FUBO daily chart

The author owns shares of FUBO.

Share: Feed news

Information on these pages contains forward-looking statements that involve risks and uncertainties. Markets and instruments profiled on this page are for informational purposes only and should not in any way come across as a recommendation to buy or sell in these assets. You should do your own thorough research before making any investment decisions. FXStreet does not in any way guarantee that this information is free from mistakes, errors, or material misstatements. It also does not guarantee that this information is of a timely nature. Investing in Open Markets involves a great deal of risk, including the loss of all or a portion of your investment, as well as emotional distress. All risks, losses and costs associated with investing, including total loss of principal, are your responsibility. The views and opinions expressed in this article are those of the authors and do not necessarily reflect the official policy or position of FXStreet nor its advertisers. The author will not be held responsible for information that is found at the end of links posted on this page.

If not otherwise explicitly mentioned in the body of the article, at the time of writing, the author has no position in any stock mentioned in this article and no business relationship with any company mentioned. The author has not received compensation for writing this article, other than from FXStreet.

FXStreet and the author do not provide personalized recommendations. The author makes no representations as to the accuracy, completeness, or suitability of this information. FXStreet and the author will not be liable for any errors, omissions or any losses, injuries or damages arising from this information and its display or use. Errors and omissions excepted.

The author and FXStreet are not registered investment advisors and nothing in this article is intended to be investment advice.

Recommended content


Recommended content

Editors’ Picks

AUD/USD: Formidable resistance sits above 0.6500

AUD/USD: Formidable resistance sits above 0.6500

AUD/USD reversed part of Tuesday’s pronounced recovery, coming under renewed downside pressure on the back of the late rebound in the US Dollar. The move higher in the Greenback was propped up by prospects of further progress on the trad front, while speculation kept pointing to a later-than-expected Fed rate cuts.

EUR/USD: Another drop to 1.1060 is not ruled out

EUR/USD: Another drop to 1.1060 is not ruled out

EUR/USD rapidly faded its initial move to weekly highs around the 1.1270 zone on Wednesday, refocusing on the downside and approaching the 1.1160 region toward the closing bell on Wall Street. The pair’s pullback came on the back of the firm tone in the Greenback, which managed to regain balance and reverse initial losses, all ahead of Thursday’s release of US Retail Sales and the speech by the Fed’s Powell.

Gold looks consolidative below 3,200

Gold looks consolidative below 3,200

Gold appears to have entered a brief consolidation phase below the $3,200 mark per troy ounce on Wednesday, following an earlier drop to five-week lows. The retreat came as investors continued to rotate out of the safe-haven asset, with growing optimism over trade developments driving steady selling in the metal.

$100M DeFi Development funding sends Solana price above 73-day resistance

$100M DeFi Development funding sends Solana price above 73-day resistance

Solana price surged past $184 on Wednesday, marking a 25% gain in May. The rally follows a fresh capital injection by DeFi Development, reaffirming institutional confidence in Solana’s blockchain ecosystem amid favorable macroeconomic signals. 

US-China trade truce only emphasizes timeless investing truths

US-China trade truce only emphasizes timeless investing truths

Markets roared back to life as the US and China hit pause on their escalating trade war, with both sides emphasizing mutual respect and dignity. But it wasn’t the fine print that moved markets—it was the mood shift. Investors rushed back into risk assets, betting that the worst might be behind us.

The Best brokers to trade EUR/USD

The Best brokers to trade EUR/USD

SPONSORED Discover the top brokers for trading EUR/USD in 2025. Our list features brokers with competitive spreads, fast execution, and powerful platforms. Whether you're a beginner or an expert, find the right partner to navigate the dynamic Forex market.

Forex MAJORS

Cryptocurrencies

Signatures

Best Brokers of 2025