FTSE 100 (UK) Elliott Wave technical analysis [Video]
![FTSE 100 (UK) Elliott Wave technical analysis [Video]](https://editorial.fxstreet.com/images/Markets/Equities/FTSE/close-up-of-apple-iphone-screen-with-stock-exchange-16817528_XtraLarge.jpg)
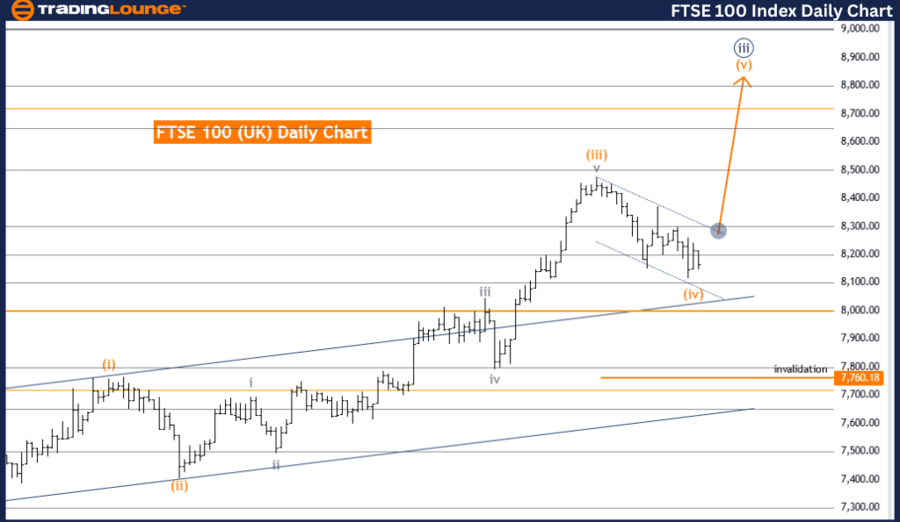
FTSE 100 (UK) Elliott Wave Analysis Trading Lounge Day Chart.
FTSE 100 (UK) Elliott Wave technical analysis
Function: Trend.
Mode: Impulsive.
Structure: Orange wave 5.
Position: Navy blue wave 3.
Direction next lower degrees: Navy blue wave 4.
Details: Orange wave 4 looking completed. Now orange wave 5 of navy blue wave 3 is in play.
Wave cancel invalid level: 7760.18.
The FTSE 100 Elliott Wave analysis on the daily chart aims to identify and track the market trend using an impulsive mode. The current wave structure is classified as orange wave 5, positioned within the broader context of navy blue wave 3. This indicates that the market is in an impulsive phase, which is characterized by a strong directional movement.
The function of this analysis is to observe and interpret the trend behavior within the FTSE 100 market. The impulsive mode signifies that the market is currently experiencing a robust directional movement as part of the overall wave pattern. Specifically, orange wave 5 is in play, indicating that the market is advancing within the framework of navy blue wave 3.
The direction for the next lower degrees is identified as navy blue wave 4. This suggests that after the completion of the current impulsive phase in orange wave 5, the market is expected to transition into the next phase, known as navy blue wave 4. This phase will likely mark a corrective movement following the completion of the current impulsive trend.
Detailed observations in the analysis indicate that orange wave 4 appears to be completed. This means that the market has likely finished the preceding corrective phase and is now advancing into orange wave 5 of navy blue wave 3. This ongoing wave will continue the impulsive pattern within the broader navy blue wave 3 context.
An important aspect of this analysis is the wave cancel invalid level, set at 7760.18. This level serves as a critical point for maintaining the validity of the current wave structure. If the market price exceeds this level, the current wave count would be invalidated, necessitating a reassessment of the Elliott Wave analysis and potentially altering the market outlook.
In summary, the FTSE 100 daily chart analysis indicates that the market is currently in an impulsive phase within orange wave 5, which is part of the larger navy blue wave 3. Once orange wave 5 is complete, the market is expected to transition into navy blue wave 4, initiating a corrective sequence. The wave cancel invalid level at 7760.18 is crucial for confirming the current wave count and guiding future market expectations based on Elliott Wave principles.
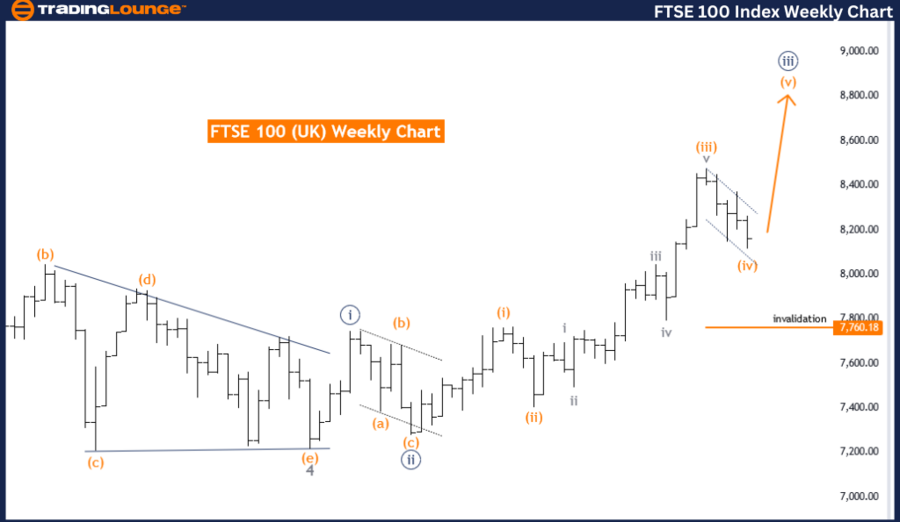
FTSE 100 (UK) Elliott Wave analysis weekly chart
Function: Trend.
Mode: Impulsive.
Structure: Orange wave 5.
Position: Navy blue wave 3.
Direction next lower degrees: Navy blue wave 4.
Details: Orange wave 4 looking completed. Now orange wave 5 of navy blue wave 3 is in play.
Wave cancel invalid level: 7760.18.
The FTSE 100 (UK) Elliott Wave analysis on the weekly chart provides a detailed examination of the market trend using an impulsive mode. This analysis focuses on identifying the current wave structure and predicting future movements within the Elliott Wave framework. The structure under observation is orange wave 5, positioned within the larger context of navy blue wave 3.
The function of this analysis is to track the ongoing trend in the FTSE 100 market, which is currently in an impulsive phase. This phase is characterized by a strong directional movement that is part of a broader wave pattern. The impulsive mode indicates that the market is moving forcefully in one direction, specifically within the orange wave 5 structure of navy blue wave 3.
The direction for the next lower degrees is identified as navy blue wave 4. This suggests that following the completion of the current impulsive phase in orange wave 5, the market is expected to transition into a corrective phase, known as navy blue wave 4. This phase will likely involve a pullback or consolidation after the current upward movement.
Detailed analysis reveals that orange wave 4 appears to be completed. This completion signifies that the market has finished its previous corrective phase and is now advancing into orange wave 5 of navy blue wave 3. This ongoing wave represents the continuation of the impulsive trend within the larger navy blue wave 3 framework.
An essential component of this analysis is the wave cancel invalid level, set at 7760.18. This level acts as a critical threshold for validating the current wave structure. If the market price exceeds this level, it would invalidate the existing wave count, necessitating a reassessment of the Elliott Wave analysis and potentially altering the market outlook.
In summary, the FTSE 100 weekly chart analysis indicates that the market is currently in an impulsive phase within orange wave 5, which is part of the larger navy blue wave 3. Once orange wave 5 is complete, the market is expected to transition into navy blue wave 4, initiating a corrective sequence. The wave cancel invalid level at 7760.18 is crucial for confirming the current wave count and guiding future market expectations based on Elliott Wave principles.
FTSE 100 (UK) Elliott Wave technical analysis [Video]
Author

Peter Mathers
TradingLounge
Peter Mathers started actively trading in 1982. He began his career at Hoei and Shoin, a Japanese futures trading company.


