Fortinet Inc. (FTNT) Stocks Elliott Wave technical analysis [Video]
![Fortinet Inc. (FTNT) Stocks Elliott Wave technical analysis [Video]](https://editorial.fxsstatic.com/images/i/Equity-Index_S&P500-2_XtraLarge.jpg)
FTNT Elliott Wave Analysis Trading Lounge.
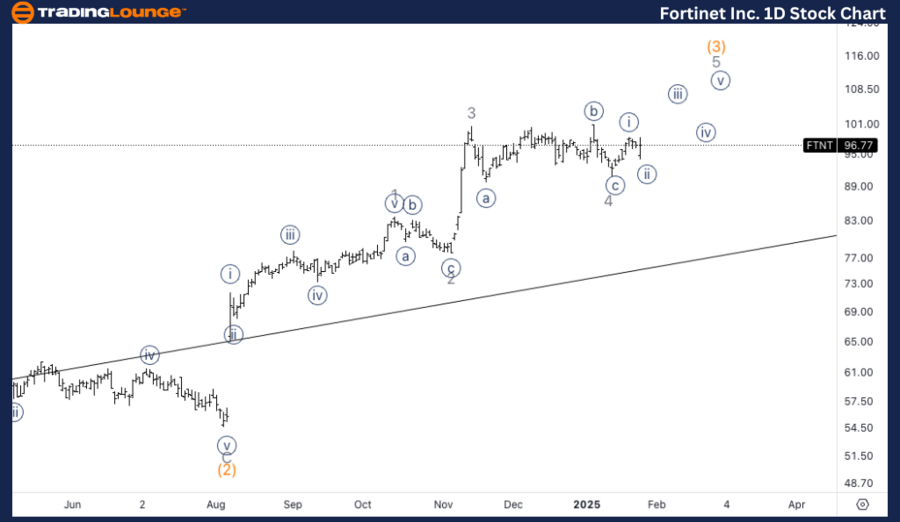
Fortinet Inc., (FTNT) Daily Chart.
FTNT Elliott Wave technical analysis
Function: Trend.
Mode: Impulsive.
Structure: Motive.
Position: Wave 5 of (3).
Direction: Upside in wave 5.
Details: We are anticipating further upside into wave 5 of (3). Given the fact wave 3 was shorter than 1 we need to expect a wave 5 shorter than wave 3. The alternative count would suggest a wave (3) is already in place and we’d now be in the early stages of a wave (4).
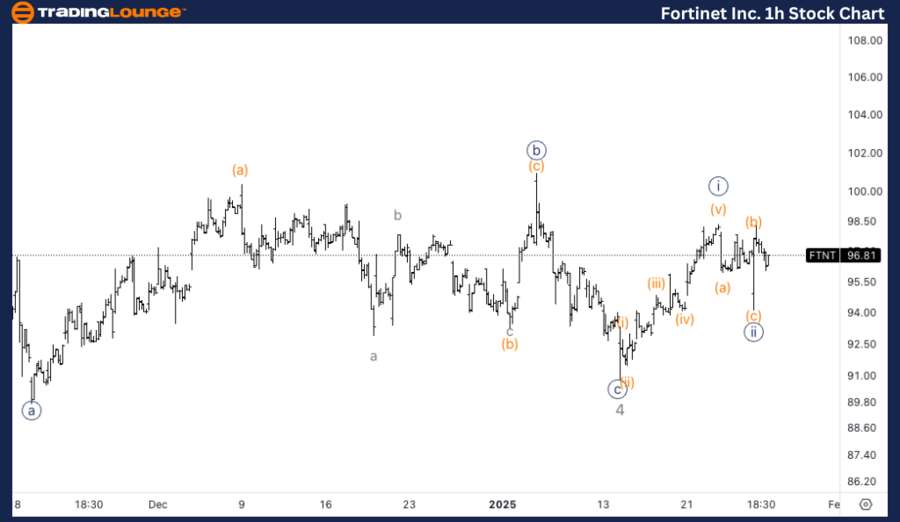
Fortinet Inc., (FTNT) 1H Chart.
FTNT Elliott Wave technical analysis
Function: Trend.
Mode: Impulsive.
Structure: Motive.
Position: Wave {iii} of 5.
Direction: Upside in wave {iii}.
Details: Looking for upside into wave {iii} as we seem to identify a three wave move in what could be wave {ii} of 5.
In this Elliott Wave analysis, we will review the trend structure of Fortinet Inc., (FTNT) using both the daily and 1-hour charts to assess the current wave position and potential price movements.
FTNT Elliott Wave technical analysis – Daily chart
Fortinet Inc. (FTNT) is expected to continue its upward trajectory in wave 5 of (3). Since wave 3 was shorter than wave 1, we anticipate that wave 5 will also be shorter than wave 3. The alternative count suggests that wave (3) may already be complete, meaning the stock could be entering the early stages of wave (4), which would indicate a potential corrective move before further upside.
FTNT Elliott Wave technical analysis – One-hour chart
On the 1-hour chart, FTNT shows the potential for further upside in wave {iii} of 5. A three-wave move in what could be wave {ii} suggests that wave {iii} is about to start, signaling further bullish momentum.
Technical analyst: Alessio Barretta.
FTNT Elliott Wave technical analysis [Video]
Author

Peter Mathers
TradingLounge
Peter Mathers started actively trading in 1982. He began his career at Hoei and Shoin, a Japanese futures trading company.


