|

Fortinet Inc. (FTNT) Elliott Wave technical analysis [Video]

FTNT Elliott Wave analysis

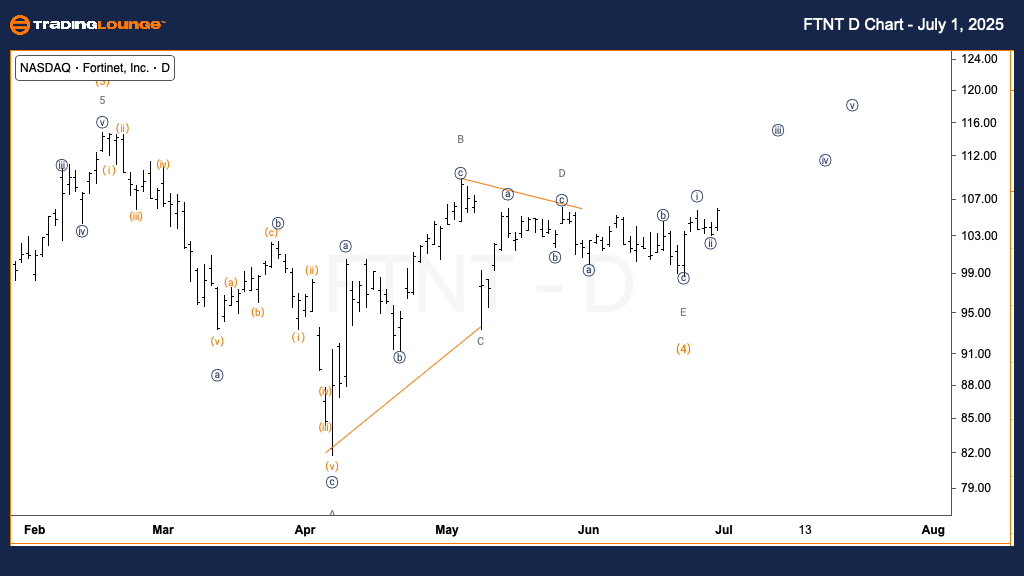
Fortinet Inc. (FTNT) – Daily chart overview

Function: Trend.

Mode: Impulsive.

Structure: Motive.

Position: Wave 1 of (5).

Direction: Upside in Wave 1.

Details: Wave (4) appears to have completed within a triangle pattern. With price support above $100, the next move is likely upward continuation in Wave 1.

Fortinet Inc. is showing signs of entering a new bullish phase on the daily chart. Following the completion of Wave (4), which formed as a triangle, the market has found a technical base for Wave (5) to begin. With strong support holding above the $100 level, price action is aligned with the development of Wave 1 of (5), reinforcing the overall bullish outlook.

Chart

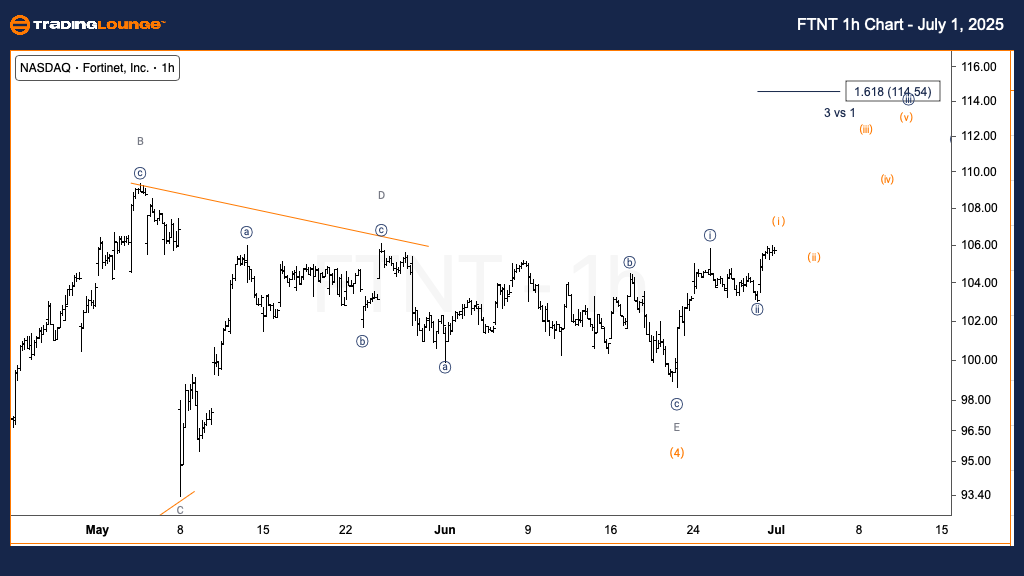
Fortinet Inc. (FTNT) – One-hour chart overview

Function: Trend.

Mode: Impulsive.

Structure: Motive.

Position: Wave {iii} of 1.

Direction: Acceleration in Wave {iii}.

Details: Wave {ii} appears complete. A minor pullback in Wave (ii) of {iii} may occur before continued upward movement.

The 1-hour chart supports the broader trend with a confirmed progression into Wave {iii} of 1. After concluding Wave {ii}, price action indicates a potential short-term correction within Wave (ii) of {iii}. Despite this, the dominant trend remains bullish, with upside acceleration likely as the impulsive sequence unfolds.

Chart

Fortinet Inc. (FTNT) Elliott Wave technical analysis [Video]

Author

Peter Mathers

Peter Mathers

TradingLounge

Peter Mathers started actively trading in 1982. He began his career at Hoei and Shoin, a Japanese futures trading company.

More from Peter Mathers
Share:

Markets move fast. We move first.

Orange Juice Newsletter brings you expert driven insights - not headlines. Every day on your inbox.

By subscribing you agree to our Terms and conditions.

Editor's Picks

EUR/USD struggles for direction amid USD gains

EUR/USD is trimming part of its earlier gains, coming under some mild downside pressure near 1.1730 as the US Dollar edges higher. Markets are still digesting the Fed’s latest rate decision, while also looking ahead to more commentary from Fed officials in the sessions ahead.

GBP/USD drops to daily lows near 1.3360

Disappointing UK data weighed on the Sterling towards the end of the week, triggering a pullback in GBP/USD to fresh daily lows near 1.3360. Looking ahead, the next key event across the Channel is the BoE meeting on December 18.

Gold losses momentum, challenges $4,300

Gold now gives away some gains and disputes the key $4,300 zone per troy ounce following earlier multi-week highs. The move is being driven by expectations that the Fed will deliver further rate cuts next year, with the yellow metal climbing despite a firmer Greenback and rising US Treasury yields across the board.

Litecoin Price Forecast: LTC struggles to extend gains, bullish bets at risk

Litecoin (LTC) price steadies above $80 at press time on Friday, following a reversal from the $87 resistance level on Wednesday. Derivatives data suggests a bullish positional buildup while the LTC futures Open Interest declines, flashing a long squeeze risk.

Big week ends with big doubts

The S&P 500 continued to push higher yesterday as the US 2-year yield wavered around the 3.50% mark following a Federal Reserve (Fed) rate cut earlier this week that was ultimately perceived as not that hawkish after all. The cut is especially boosting the non-tech pockets of the market.

Aave Price Forecast: AAVE primed for breakout as bullish signals strengthen

Aave (AAVE) price is trading above $204 at the time of writing on Friday and approaching the upper boundary of its descending parallel channel; a breakout from this structure would favor the bulls.