|premium|

Ford (F Stock) needs to ride further downside before continuing the rally

Ford Motor Company (commonly known as Ford) is an American multinational automobile manufacturer headquartered in Dearborn, Michigan, United States. It was founded by Henry Ford and incorporated on June 16, 1903. The company sells automobiles and commercial vehicles under the Ford brand, and luxury cars under its Lincoln luxury brand.

FORD daily chart

Ford

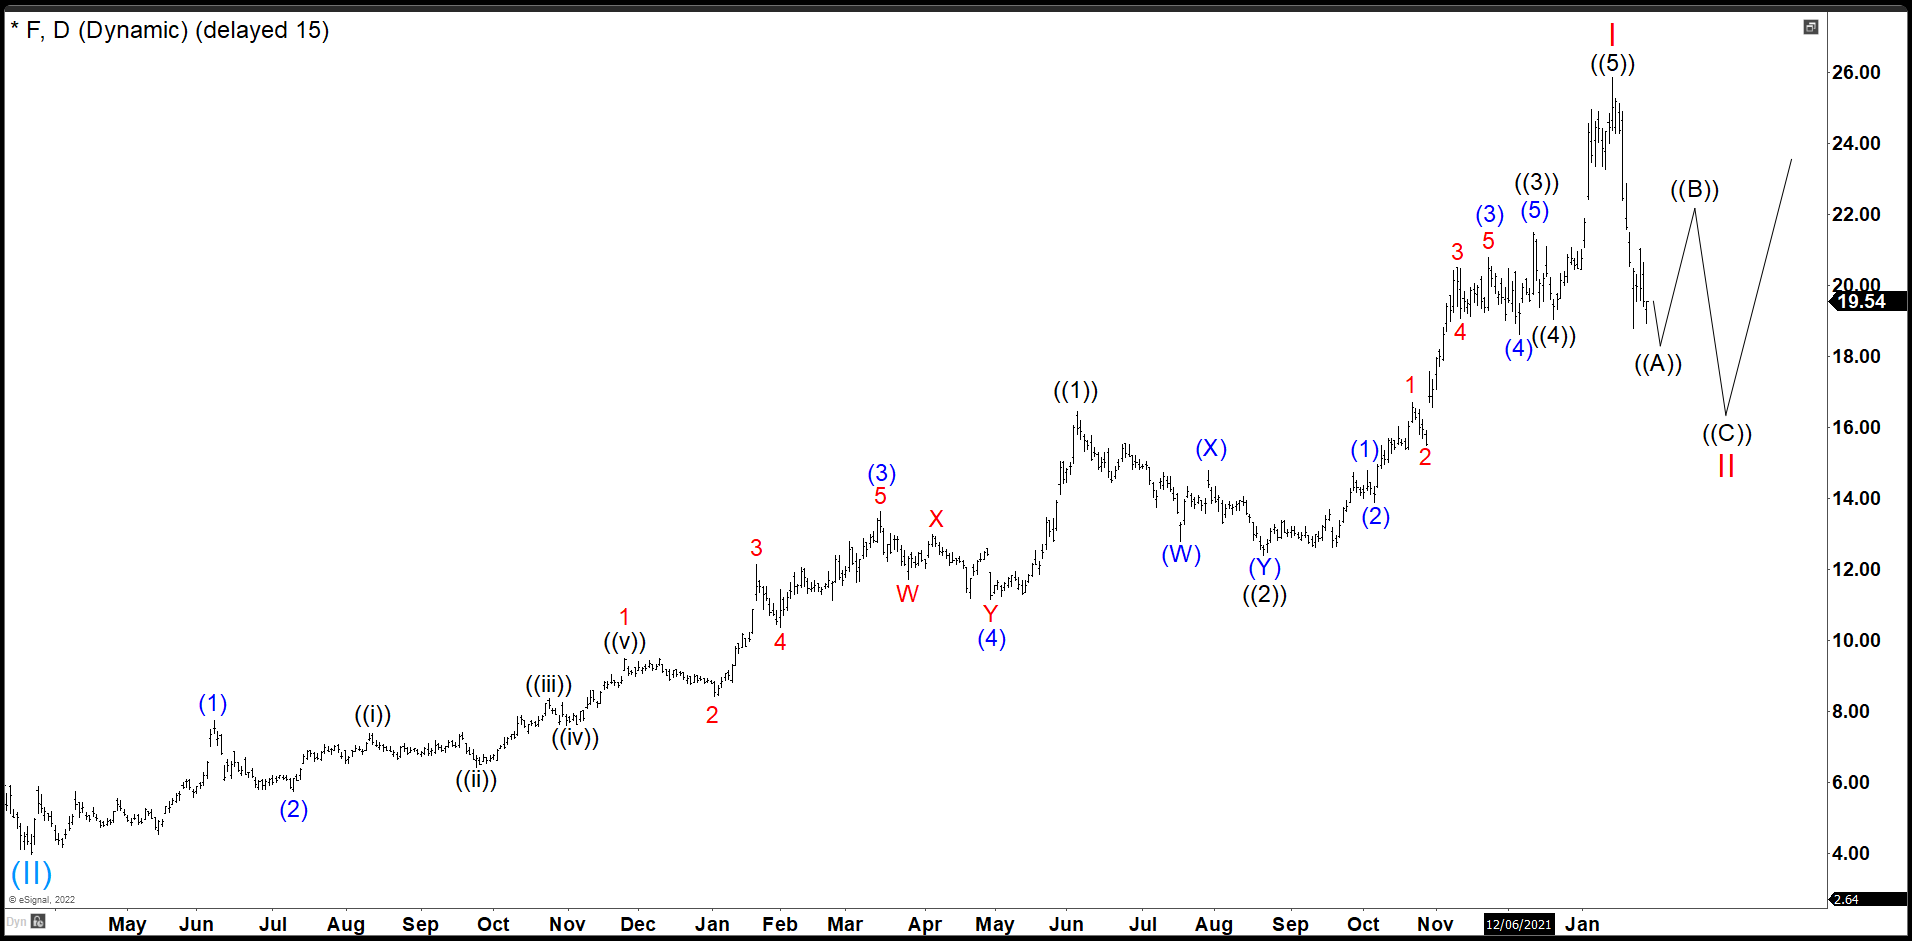
Ford started a rally from March 2020 low after covid19 crash. From there, we can see 5 waves up forming an Impulse Structure ending on December 13th 2021. (If you want to learn more about Elliott Wave Theory, please follow these links: Elliott Wave Education and Elliott Wave Theory). Wave ((1)) ended an impulse structure at 16.45. Then F corrected in 3 swings making a double fcorrection structure, ending wave ((2)) at 12.38. Another rally resumed from the low completing wave ((3)) at 21.49 and pullback again making a flat correction ended wave ((4)) at 19.05. Then last push higher made and ended the impulse structure and completed wave ((5)) and wave I of the leading diagonal at 25.87.

After peak, the stock dropped strongly losing more than 27% building an impulse structure. To complete the impulse, Ford needs to break 18.80 low to make 5 swings down which one we will labeled as wave ((A)). Then we should see a corrective bounce in 3 or 7 swings as wave ((B)) before turning lower again. This turn as wave ((C)) should build an impulse structure again, that means, 5 swings down are need to complete ((C)) and wave II. To conclude the whole correction as wave II we are suggesting a 15.00 – 16.00 area where Ford should continue with the rally.

Premium

You have reached your limit of 3 free articles for this month.

Start your subscription and get access to all our original articles.

Subscribe to PremiumSign In

Author

Elliott Wave Forecast Team

Elliott Wave Forecast Team

ElliottWave-Forecast.com

More from Elliott Wave Forecast Team
Share:

Editor's Picks

AUD/USD regains mild traction, falters near 0.7150

AUD/USD gathers some steam and manages to flirt with the 0.7150 level on Thursday. However, the pair has retraced some of Wednesday’s significant pullback due to renewed selling pressure on the Greenback and a slight improvement in risk sentiment following hopes of a deal in the Middle East. Wrapping up the Australian docket, the RBA’s Hauser will speak early on Friday.

USD/JPY trades below 160.00 intervention threshold; bullish bias intact

The USD/JPY pair attracts some sellers during the Asian session amid fears that authorities will step in again to prop up the Japanese Yen. Furthermore, the Israel-Lebanon truce prompts some profit-taking around the US Dollar and exerts downward pressure on the currency pair.

Gold puts its 200-day SMA to the test near $4,420

Gold keeps the bullish stance in place in the latter part of Thursday’s session, although a convincing break above the key $4,500 mark per troy ounce still remains elusive. The precious metal’s advance comes amid the resurgence of some selling interest around the Greenback, improving risk sentiment, and declining US Treasury yields across the board.

XRP plummets as ETF outflows, geopolitical tensions reinforce bearish outlook
Ripple (XRP) edges lower, trading around $1.15 at the time of writing on Thursday, its lowest price since February 6. The cross-border money remittance token is extending the sell-off for the fifth consecutive day, reflecting persistent headwinds from ongoing geopolitical tensions and investor uncertainty.
Nonfarm payrolls: Testing the limits of Fed policy patience

The upcoming nonfarm payrolls report for May will provide the final update on the US labor market before Kevin Warsh attends his first policy meeting as the new Fed Chair later this month.

Recession on paper: What really moves the Canadian Loonie now?

Statistics Canada handed the headline writers a gift and the analysts a headache. Real GDP shrank 0.1% on an annualized basis in the first quarter, and with the fourth quarter of 2025 revised down to a 1.0% contraction, that is two negative quarters in a row, the textbook definition of a technical recession and Canada's first since the pandemic.