False breakout for S&P 500? Discover what it could mean [Video]
![False breakout for S&P 500? Discover what it could mean [Video]](https://editorial.fxstreet.com/images/Markets/Equities/SP500/wall_street_nyse1-637299020939878938_XtraLarge.jpg)
Find out how a false breakout could unfold in S&P 500 should a short-term bearish case materialize while the debate on the debt ceiling is still ongoing.
Pay attention to the important axis area as discussed in the video below before a shakeout is triggered.
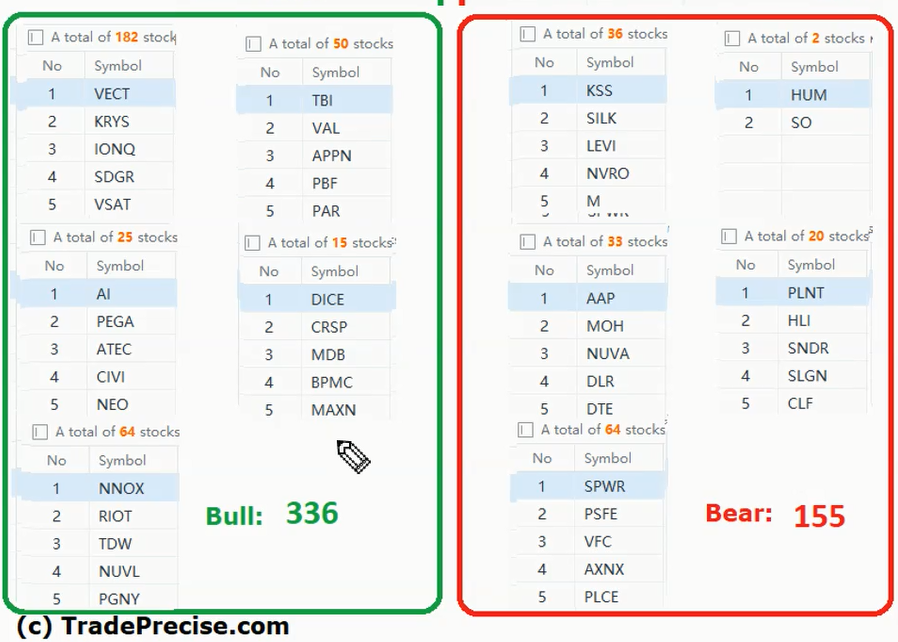
The bullish setup vs. the bearish setup is 336 to 155 from the screenshot of my stock screener below pointed to a positive market environment.
The extended run-up in the Nasdaq 100 is also reflected by a handful of the FAANG stocks and the heavyweight in the semiconductor group. If one missed out this climatic run to the upside, pay attention to the end of the video discussion of the Nasdaq 100 on what to anticipate after the impressive run.
Author

Ming Jong Tey
Independent Analyst
Ming Jong Tey has been trading since 2008. He started his learning journey from technical analysis (indicators, Fibonacci, etc...) to value investing. Throughout his journey, he develops an interest in price action with chart pattern trading.


