|

Failure of the market breadth thrust? Refer to the Wyckoff logic from the bear market in 2011 [Video]

The market breadth thrust drops sharply from above 90 to 33 in 2 weeks, which is a weakness in the market. Will this sharp pullback violate the previous analysis on spotting the market bottom with the breadth thrust?

Let’s refer to the Wyckoff logic from 2011 bear market to find out whether the current pullback in S&P 500 is still healthy. Click and watch the video below:

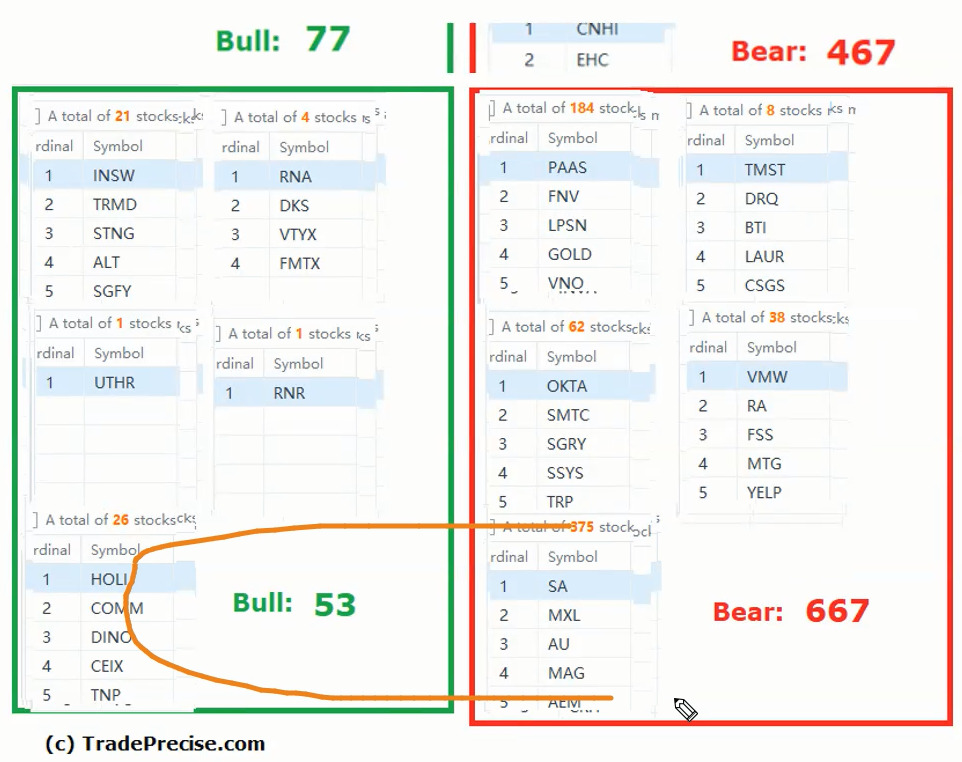
The bullish setup vs. the bearish setup is 53 to 667 from the screenshot of my stock screener below. More stock leaders were shot down with only a handful of stocks from the Biotech and Solar industry groups being resilient and bucking the trend.
Wyckoff

Despite multiple attempts to stop the down move with presence of demand, supply is still dominating. Hence S&P 500 is expected to have more weakness ahead.

Author

Ming Jong Tey

Ming Jong Tey

Independent Analyst

Ming Jong Tey has been trading since 2008. He started his learning journey from technical analysis (indicators, Fibonacci, etc...) to value investing. Throughout his journey, he develops an interest in price action with chart pattern trading.


More from Ming Jong Tey
Share:

Editor's Picks

GBP/USD breaches below 1.3500, two-day lows

GBP/USD faces renewed selling pressure, eroding the earlier advance and slipping back to the sub-1.3500 region on Wednesday. Cable’s loss of upside momentum follows the resurgence of the demand for the Greenback amid steady geopolitical tensions. Looking ahead, the British Pound is expected to remain under scrutiny in light of the release of UK GDP data on Thursday.

EUR/USD weakens to multi-day lows near 1.1520

EUR/USD makes a U-turn and trades with decent losses near 1.1520 following the closing bell on Wall Street on Wednesday. The US Dollar’s recovery post-US CPI data keeps the risk complex under pressure in a context where geopolitics takes centre stage once again. Moving forward, attention remains on US inflation with the release of Producer Prices alongside weekly Claims.

Gold holds comfortably above $4,400 after hitting fresh 10-week highs

Gold sits above $4,400 after hitting its highest level since June 5, at $4,450, in Asia on Thursday. Gold looks to build on the uptrend, following soft US inflation data. Receding Fed-hike bets continue to drive flows towards the non-yielding bullion amid subdued US Dollar price action. However, the US-Iran standoff could limit any meaningful USD decline and cap the precious metal as traders now look to the US PPI for a fresh impetus.

Bitcoin faces thin liquidity and missing demand amid seller stress — Glassnode
Bitcoin (BTC) is showing signs of growing market exhaustion, with weakening liquidity and subdued demand leaving the market vulnerable to a sharp move, according to a Glassnode report on Wednesday. The firm stated that Bitcoin is trading between two important cost-basis levels as market activity has fallen to its lowest point since 2019.
Why is Crude Oil priced for a reopening the ships haven't made?

Fourteen vessels crossed the Strait of Hormuz on Tuesday. Before the war, the count ran near 120 a day. In the sessions since the waterway was publicly declared open, Brent has drifted back to $87 and West Texas Intermediate to $81, both a little lower again on Wednesday, with daily momentum on each unwound from the top of its range in late July to the low twenties now.

Why is Crude Oil priced for a reopening the ships haven't made?
Fourteen vessels crossed the Strait of Hormuz on Tuesday. Before the war, the count ran near 120 a day. In the sessions since the waterway was publicly declared open, Brent has drifted back to $87 and West Texas Intermediate (WTI) to $81, both a little lower again on Wednesday, with daily momentum on each unwound from the top of its range in late July to the low twenties now.