EUR/USD - Trendline offers support & risk reversals shed bullish bias, what's next?
- The EUR/USD dropped below 100-day MA on German political uncertainty.
- Risk reversals indicate falling demand for EUR calls.
- EUR drop unjustified?

EUR/USD closed below the 100-day MA yesterday but failed to cut through the support offered by the trendline sloping downwards from the Sep. 8 high and Sep. 20 high.
So is the drop in the EUR justified? Mario Blascak, European Chief Analyst at FXStreet, believes there is no problem with any scenario - new elections or minority government. Blascak says, "countries like Belgium, Holland and Czech Republic have a long tradition of forming a government for ages and nothing happened to countries’ economies. In terms of currency reaction, the move downwards has been a bit unjustified and it is likely that the EUR/USD will correct towards $1.1800 soon.
However, risk reversals indicate a falling demand for EUR calls.
Risk reversals
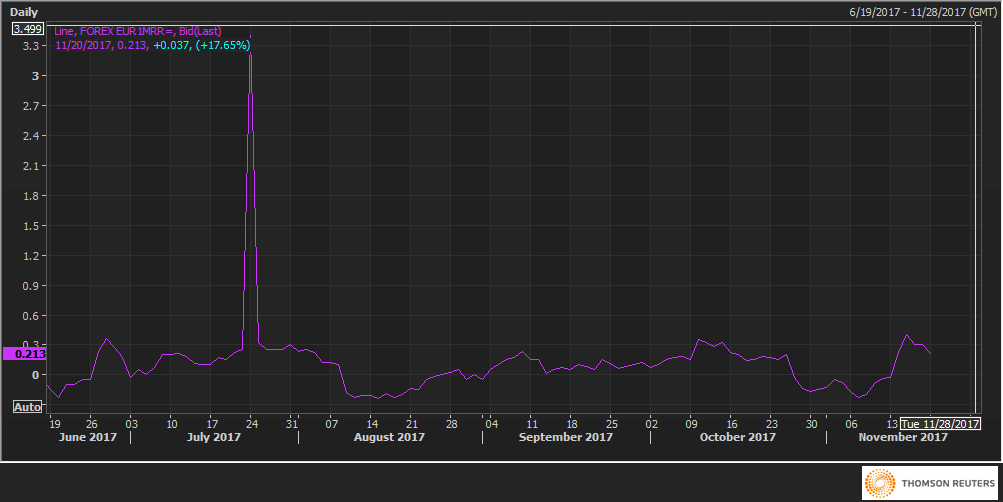
- The one-month 25 delta risk reversals gauge, though positive, has slipped from 0.40 to 0.213 in the last few days.
- The decline indicates falling demand for bullish bets (EUR calls).
Further, the common currency is unlikely to receive substantial support from the monetary policy as indicated by Draghi's comments yesterday. Clearly, there is merit in being cautious.
Kathy Lien from BK Asset Management says the common currency could drop to 1.16 on political concerns unless the Eurozone economic data offers a positive surprise.
EUR/USD Technical Outlook
Daily moving averages adopt a bearish bias - The 50-day MA has topped out and could cut the 100-day from above (bearish crossover) if the pair breaks below the trendline support of 1.1715.
However, on the 4-hour timeframe, a bullish crossover between the 50-MA and 200-MA is almost confirmed. Clearly, the momentum studies stand divided.
FXStreet Chief Analyst Valeria Bednarik writes, "technically, the pair reversed its early Momentum, and heads into Asian opening with a short-term bearish bias, as technical indicators in the 4 hours chart faltered around their mid-lines, gaining downward momentum, but still above Friday's lows, as the price was unable to establish above a bearish 20 SMA, now also below the 38.2% retracement of the latest bullish run at 1.1745, all of which leans the scale towards the downside, particularly on an extension below 1.1705, the 50% retracement of the same rally. A recovery beyond the strong 1.1820/30 resistance area is required to revert the current negative stance, something quite unlikely in the current scenario."
Support levels: 1.1705 1.1670 1.1630
Resistance levels: 1.1745 1.1790 1.1830
Author

Omkar Godbole
FXStreet Contributor
Omkar Godbole, editor and analyst, joined FXStreet after four years as a research analyst at several Indian brokerage companies.