|

EUR/USD treading water near 1.0660, hanging near the top of the range

  • EUR/USD spends Friday trading into familiar territory.
  • US PMIs kept the USD capped with a mixed print.
  • USD on track to close out with weekly gains, but capped for the end of the week.

The EUR/USD is trading into neutral ground heading into the end of the trading week, testing well-trodded ground near the 1.0660 handle.

US Purchasing Manager Index (PMI) figures came in off-kilter, triggering a soft walkback for the Greenback (USD) during the Friday trading session, but keeping losses limited to intraday boundaries.

European PMI figures earlier on Friday saw the Euro (EUR) ease back after an unexpected drop, with the manufacturing component printing at 43.4 versus the forecast 44.0.

The US Manufacturing PMI printed above expectations at 48.9 for September, compared to 47.9 for August, but the Services PMI component fell back to 50.2, reversing the market forecast increase to 50.6.

Read more:

Eurozone Preliminary Manufacturing PMI unexpectedly falls to 43.4 in September vs. 44.0 expected

US S&P Global Manufacturing PMI improves to 48.9, Services PMI declines to 50.2 in September

EUR/USD corkscrews on PMIs that disappoint on both sides of the pond

The economic calendar looking forward is notably thin for the first half of next week, though traders will want to keep at least one eye on US Consumer Confidence on Tuesday, as well as Wednesday's Durable Goods Orders.

Market analysts see Durable Goods Orders for August slipping back only 0.4% after the previous reading of -5.2%.

EUR/USD technical outlook

The Euro has been cycling the 1.0660 level but has so far been unable to meaningfully mount the technical level, and is pacing familiar territory to close out the trading week.

The EUR/USD fell to a Friday low of 1.0615 but recovered to the top side near Friday's peak just north of 1.0670.

Hourly candles see the EUR/USD trading just south of the 200-hour Simple Moving Average (SMA) near 1.0685.

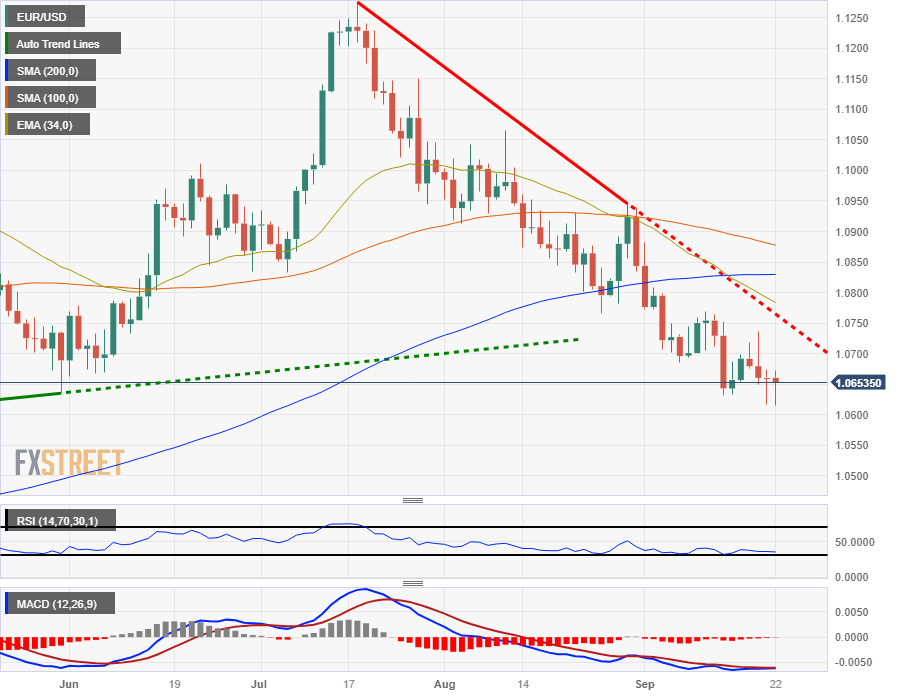
On the daily candlesticks, the Euro is decidedly bearish, continuing to decline through the 200-day SMA and down almost 5.5% from July's peak near 1.1275.

The 34-day Exponential Moving Average (EMA) is set to confirm a bearish cross of the 200-day SMA, and investors might be looking out for a relief rally to a major technical level before resuming another leg down.

EUR/USD daily chart

EUR/USD technical levels

EUR/USD

Overview
Today last price1.0657
Today Daily Change-0.0003
Today Daily Change %-0.03
Today daily open1.066
 
Trends
Daily SMA201.0745
Daily SMA501.0897
Daily SMA1001.0881
Daily SMA2001.083
 
Levels
Previous Daily High1.0674
Previous Daily Low1.0617
Previous Weekly High1.0769
Previous Weekly Low1.0632
Previous Monthly High1.1065
Previous Monthly Low1.0766
Daily Fibonacci 38.2%1.0639
Daily Fibonacci 61.8%1.0652
Daily Pivot Point S11.0627
Daily Pivot Point S21.0594
Daily Pivot Point S31.057
Daily Pivot Point R11.0683
Daily Pivot Point R21.0707
Daily Pivot Point R31.074

Author

Joshua Gibson

Joshua joins the FXStreet team as an Economics and Finance double major from Vancouver Island University with twelve years' experience as an independent trader focusing on technical analysis.

More from Joshua Gibson
Share:

Markets move fast. We move first.

Orange Juice Newsletter brings you expert driven insights - not headlines. Every day on your inbox.

By subscribing you agree to our Terms and conditions.

Editor's Picks

EUR/USD bounces toward 1.1750 as US Dollar loses strength

EUR/USD returned to the 1.1750 price zone in the American session on Friday, despite falling Wall Street, which indicates risk aversion. Trading conditions remain thin following the New Year holiday and ahead of the weekend, with the focus shifting to US employment and European data scheduled for next week.

GBP/USD nears 1.3500, holds within familiar levels

After testing 1.3400 on the last day of 2025, GBP/USD managed to stage a rebound. Nevertheless, the pair finds it difficult to gather momentum and trades with modest intraday gains at around 1.3490 as market participants remain in holiday mood.

Gold trims intraday gains, approaches $4,300

Gold retreated sharply from the $4,400  area and trades flat for the day in the $4,320 price zone. Choppy trading conditions exacerbated the intraday decline, although XAU/USD bearish case is out of the picture, considering growing expectations for a dovish Fed and persistent geopolitical tensions.

Cardano gains early New Year momentum, bulls target falling wedge breakout

Cardano kicks off the New Year on a positive note and is extending gains, trading above $0.36 at the time of writing on Friday. Improving on-chain and derivatives data point to growing bullish interest, while the technical outlook keeps an upside breakout in focus.

Economic outlook 2026-2027 in advanced countries: Solidity test

After a year marked by global economic resilience and ending on a note of optimism, 2026 looks promising and could be a year of solid economic performance. In our baseline scenario, we expect most of the supportive factors at work in 2025 to continue to play a role in 2026.

Crypto market outlook for 2026

Year 2025 was volatile, as crypto often is.  Among positive catalysts were favourable regulatory changes in the U.S., rise of Digital Asset Treasuries (DAT), adoption of AI and tokenization of Real-World-Assets (RWA).