|

EUR/USD technical anlysis: Fiber finds resistance at the 1.1263 level

  • EUR/USD is finding intraday resistance at the 1.1263 level.
  • The level to beat for bears is 1.1245 followed by 1.1220.
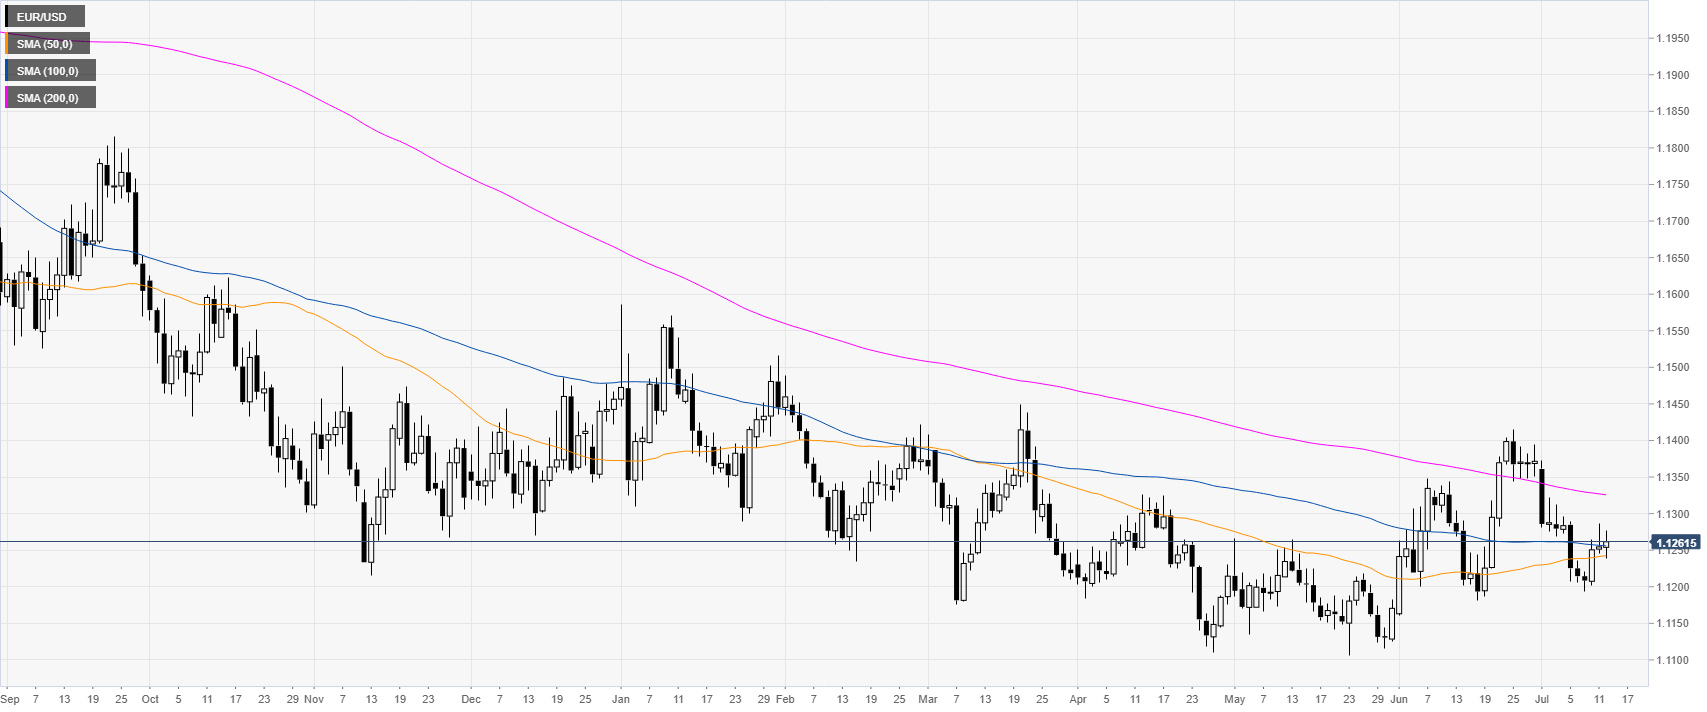
EUR/USD daily chart

EUR/USD is in a bear trend below the 1.1300 handle and its 200-day simple moving averages (DSMAs). The market is trading just above the 100 SMA.

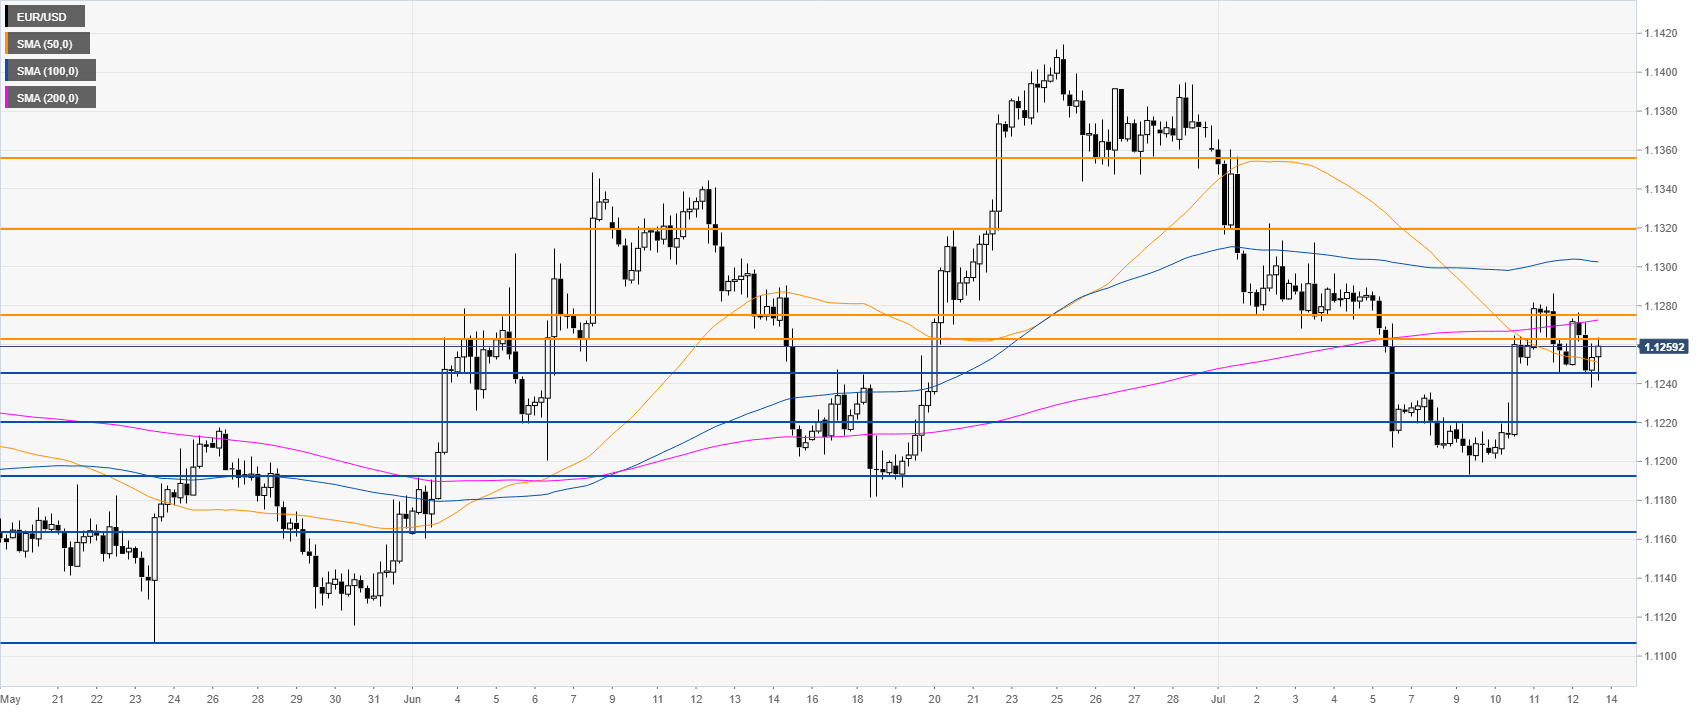
EUR/USD 4-hour chart

EUR/USD is trading just below 1.1263 resistance and the 200 SMA. The level to beat for bears is seen at 1.1245 followed by 1.1220, according to the Technical Confluences Indicator.


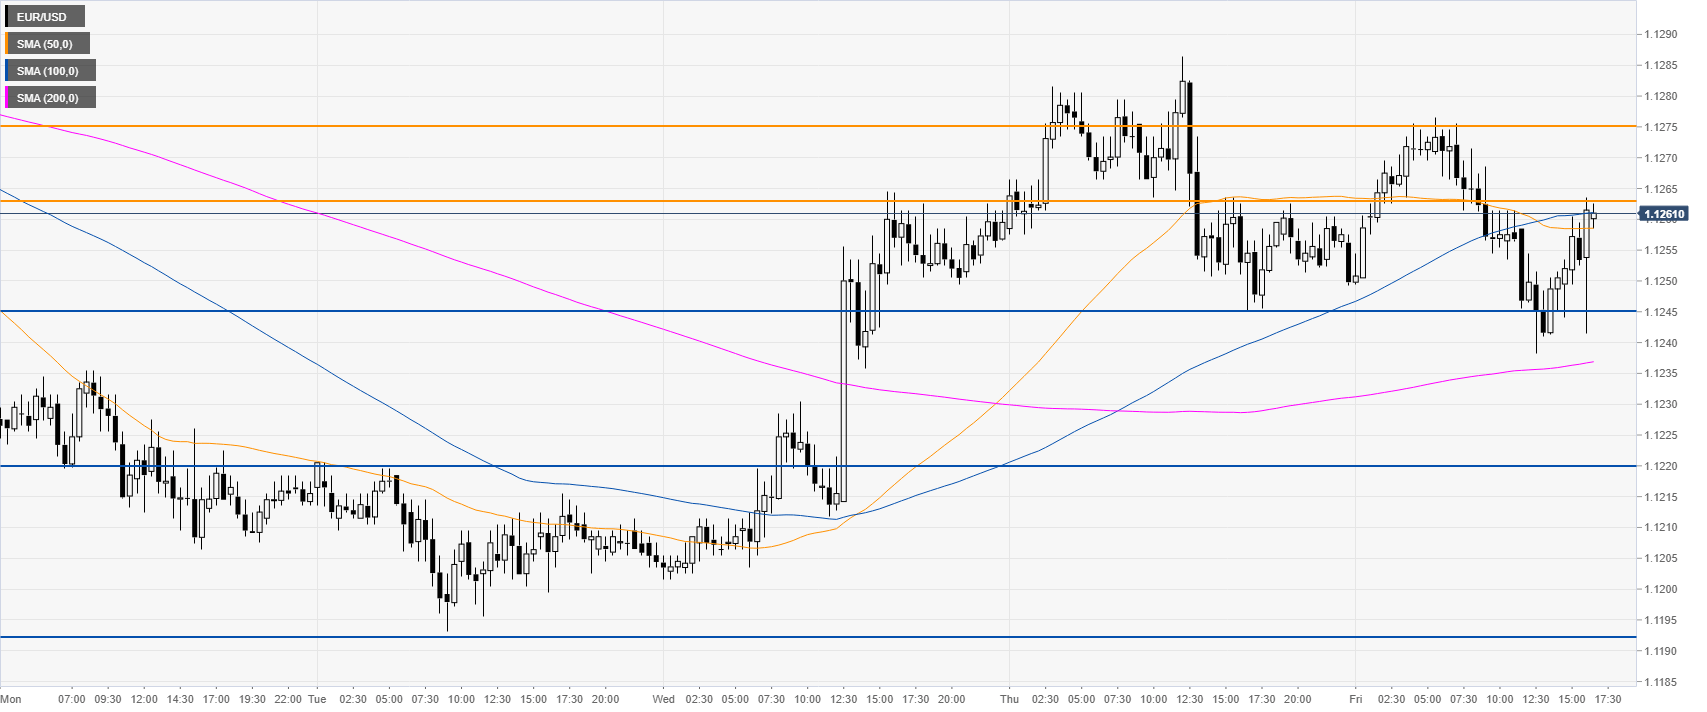
EUR/USD 30-minute chart

EUR/USD found resistance below 1.1263 and the 100 SMAs. In case 1.1263 resistances gets broken to the upside the next resistance can be located at 1.1274 , according to the Technical Confluences Indicator.


Additional key levels

EUR/USD

Overview
Today last price1.1262
Today Daily Change0.0008
Today Daily Change %0.07
Today daily open1.1254
 
Trends
Daily SMA201.1296
Daily SMA501.1229
Daily SMA1001.1262
Daily SMA2001.1344
Levels
Previous Daily High1.1286
Previous Daily Low1.1245
Previous Weekly High1.1373
Previous Weekly Low1.1207
Previous Monthly High1.1414
Previous Monthly Low1.116
Daily Fibonacci 38.2%1.1271
Daily Fibonacci 61.8%1.1261
Daily Pivot Point S11.1237
Daily Pivot Point S21.122
Daily Pivot Point S31.1196
Daily Pivot Point R11.1279
Daily Pivot Point R21.1303
Daily Pivot Point R31.132

Author

Flavio Tosti

Flavio Tosti

Independent Analyst


More from Flavio Tosti
Share:

Editor's Picks

EUR/USD looks to regain the 200-day SMA

EUR/USD regains some balance and trade just above 1.1600 the figure ahead of the opening bell in Asia. The pair initially dipped to the 1.1530 zone for the first time since November, always following the stronger US Dollar and the marked flight-to-safety in the context of the ongoing Middle East crisis
 

GBP/USD slips below key averages as geopolitical risks mount

GBP/USD fell about 0.35% on Tuesday, settling around 1.3350 after slipping below the 200-day Exponential Moving Average for the first time since early December. The pair has pulled back sharply from its late-January high near 1.3870, shedding over 500 pips in a series of lower highs and lower lows. 

Gold falls to near $5,100 as inflation fears weigh amidst Middle East conflict

Gold price faces some selling pressure near $5,100 during the early Asian session on Wednesday. The precious metal falls amid a renewed US Dollar demand and dimming prospects for US rate cuts. The US ISM Services Purchasing Managers Index report will be published later on Wednesday. 

Ethereum: Whales step up buying as short positions contract

After holding firm heading into the last weekend, Ethereum whales have returned to action, pouncing on the volatility stemming from escalating military actions between the US and Iran.

Energy shock 2.0: Why rising Gas prices could hit the Euro

Even without a confirmed, sustained disruption, the mere risk to a key global energy chokepoint is enough to inject a significant premium into European Gas markets. And for the Euro, that matters.

Ripple falters amid sell-off jitters and negative funding rates

Ripple (XRP) has come under pressure, drifting lower to $1.35 at the time of writing on Tuesday. The over 2% correction looks poised to erase the previous day’s gains, which lifted the remittance token to $1.42.