|

EUR/USD Technical Analysis: The pair remains capped by the lower 1.1600s

  • Spot remains under pressure and navigates the lower end of the recent range and close to October’s low at 1.1432.
  • Further south lies the critical 200-week SMA at 1.1319, considered the last defense of a visit to so far 2018 lows just below 1.1300 the figure.
  • On the upside, recent tops in the 1.1620 area continues to cap the upside. Interim hurdle emerges at the 21-day SMA and the 55-day SMA at 1.1553 and 1.1576, respectively.

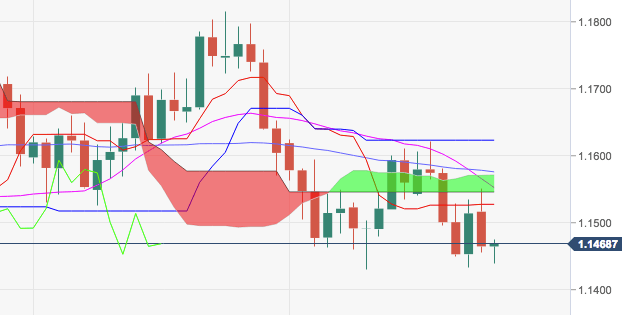
EUR/USD daily chart

EUR/USD

Overview:
    Last Price: 1.1466
    Daily change: -65 pips
    Daily change: -0.564%
    Daily Open: 1.1531
Trends:
    Daily SMA20: 1.1571
    Daily SMA50: 1.1584
    Daily SMA100: 1.1623
    Daily SMA200: 1.1909
Levels:
    Daily High: 1.154
    Daily Low: 1.1531
    Weekly High: 1.1622
    Weekly Low: 1.1433
    Monthly High: 1.1816
    Monthly Low: 1.1526
    Daily Fibonacci 38.2%: 1.1496
    Daily Fibonacci 61.8%: 1.1472
    Daily Pivot Point S1: 1.1453
    Daily Pivot Point S2: 1.1392
    Daily Pivot Point S3: 1.1351
    Daily Pivot Point R1: 1.1555
    Daily Pivot Point R2: 1.1596
    Daily Pivot Point R3: 1.1657

Author

Pablo Piovano

Born and bred in Argentina, Pablo has been carrying on with his passion for FX markets and trading since his first college years.


More from Pablo Piovano
Share:

Editor's Picks

GBP/USD advances to three-month peak beyond 1.3600

GBP/USD extends its daily rally and trades at its highest level since mid-May above 1.3600. The US Treasury Department decision to double the sice of liquidity support buyback operations for longer-dated nominal coupon securitiez weighs heavily on the US Dollar and helps the pair push higher. Earlier in the day, the data from the UK showed that annual Consumer Price Index (CPI) inflation picked up to 2.9% in July, meeting estimates, while core CPI rose by 2.6% YoY in July versus 2.5% expected.

EUR/USD surges to 11-week high above 1.1650 after US Treasury announcement

EUR/USD gathers bullish momentum and trades at its highest level since early June above 1.1650 on Wednesday. The US Dollar stays under heavy bearish pressure after the US Treasury announced that it will increase the size of liquidity support buyback operations for longer-dated nominal coupon securities. Later in the day, investors will scrutinize FOMC Minutes for fresh clues on policy outlook.

Gold pulls back from 11-week highs, battles $4,500

Gold eases from its highest level since early June, battling $4,500 in the Asian session on Thursday. The US Dollar draws some support from the US-Iran standoff and hawkish FOMC Minutes, capping the upside for the bullion. Gold short through the roof on Wednesday after the US Treasury Department stepped in to provide relief to bond markets, leading to a sharp decline in yields and boosting the non-yielding yellow metal.

HYPE soars 20% as Trump signals efforts to bring Hyperliquid to US market in White House meeting

Hyperliquid surged over 20% on Wednesday after President Donald Trump said the Commodity Futures Trading Commission is working to bring the decentralized perpetual futures platform into the US.

$20 billion offered, $2 billion taken: Why Treasury doubled its buyback cap
The US Treasury moved off its own calendar on Wednesday, and that is the part worth sitting with. At 12:32 GMT, the department said it would at least double the size of liquidity support buyback operations in the 10-year to 20-year and 20-year to 30-year sectors, lifting the maximum from $2 billion per operation to at least $4 billion, effective September 9 and running to November 4.
Why is Crude Oil priced for a reopening the ships haven't made?
Fourteen vessels crossed the Strait of Hormuz on Tuesday. Before the war, the count ran near 120 a day. In the sessions since the waterway was publicly declared open, Brent has drifted back to $87 and West Texas Intermediate (WTI) to $81, both a little lower again on Wednesday, with daily momentum on each unwound from the top of its range in late July to the low twenties now.















