EUR/USD Technical Analysis: The battle for 1.1400 figure has begun - 1.1350 short-term bear target

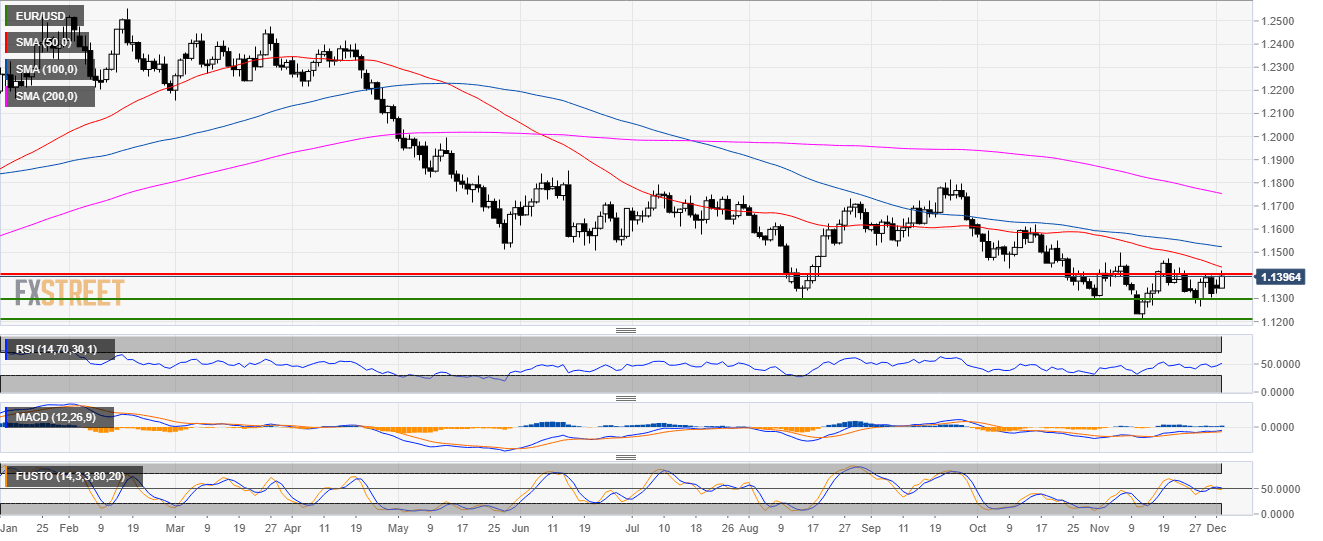
EUR/USD daily chart
- EUR/USD is trading in a bear trend below the 200-day simple moving average (SMA).
- EUR/USD is finding resistance below the 50 SMA and near 1.1400 figure.
- Stochastic is turning bearish although near the 50 line.
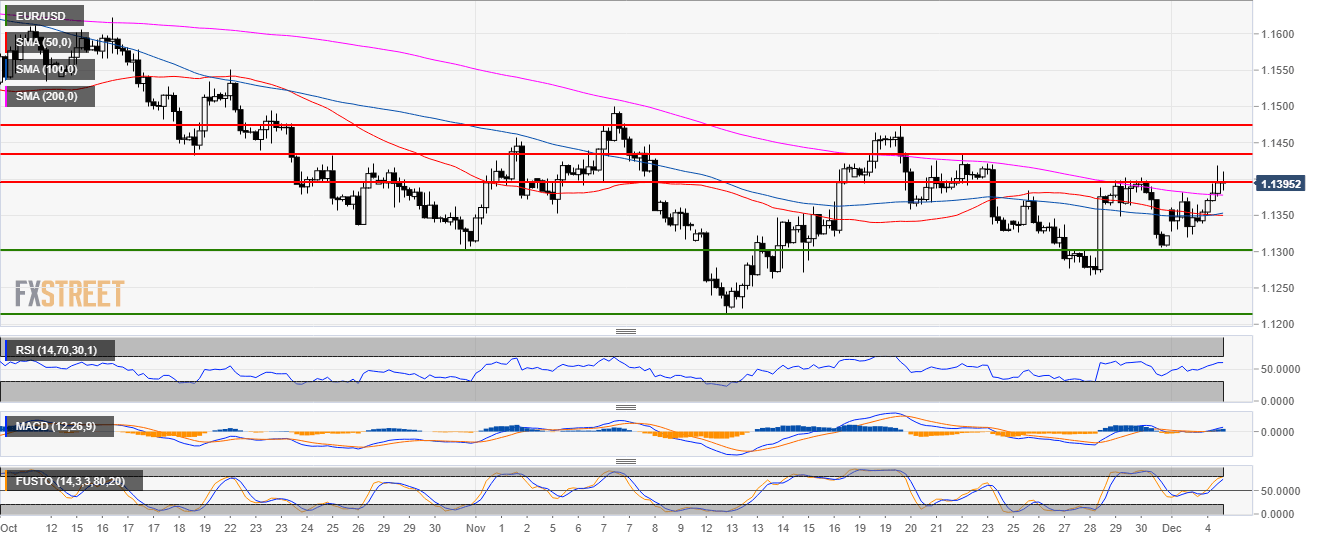
EUR/USD 4-hour chart
- Bulls are trying to break above the 1.1400 figure. They are also trying to keep the market above the 200 SMA.
- Bulls have strong resistances ahead with 1.1430 and 1.1473 levels.
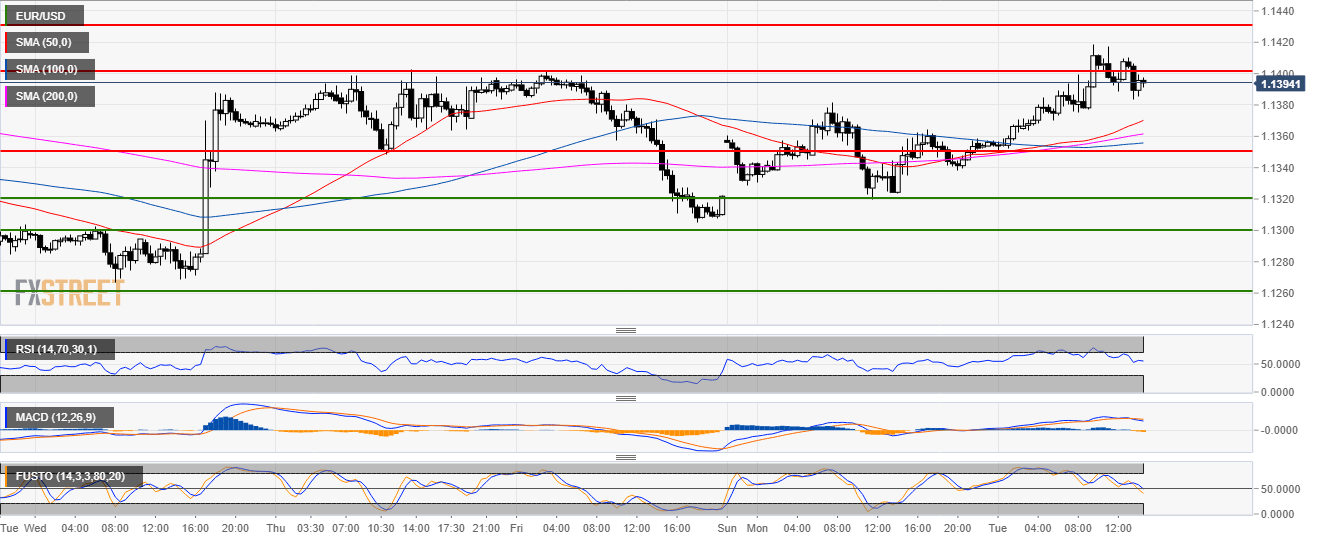
EUR/USD 30-minute chart
- Bulls met strong resistance at 1.1400 and bears will not likely give up the level so easily.
- In the short-term, it is more likely that the market will pullback to 1.1350 and possibly to 1.1320 if bears gather enough momentum.
Additional key levels
EUR/USD
Overview:
Today Last Price: 1.1396
Today Daily change: 51 pips
Today Daily change %: 0.450%
Today Daily Open: 1.1345
Trends:
Previous Daily SMA20: 1.1357
Previous Daily SMA50: 1.1443
Previous Daily SMA100: 1.1527
Previous Daily SMA200: 1.176
Levels:
Previous Daily High: 1.1382
Previous Daily Low: 1.132
Previous Weekly High: 1.1402
Previous Weekly Low: 1.1267
Previous Monthly High: 1.15
Previous Monthly Low: 1.1216
Previous Daily Fibonacci 38.2%: 1.1343
Previous Daily Fibonacci 61.8%: 1.1358
Previous Daily Pivot Point S1: 1.1316
Previous Daily Pivot Point S2: 1.1287
Previous Daily Pivot Point S3: 1.1254
Previous Daily Pivot Point R1: 1.1378
Previous Daily Pivot Point R2: 1.1411
Previous Daily Pivot Point R3: 1.144
Author

Flavio Tosti
Independent Analyst


