|

EUR/USD Technical Analysis: Scope for a new visit to 2018 lows at 1.1299

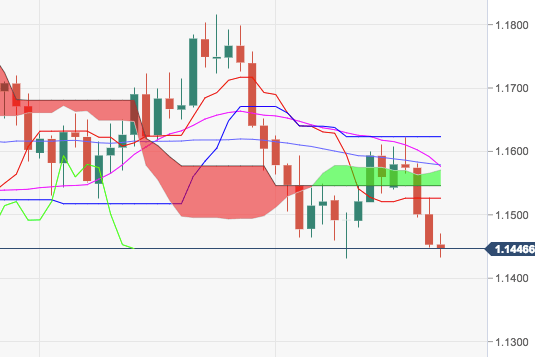
  • EUR/USD continues to grind lower this week, accelerating the downside to the mid-1.1400s after break below the critical support at 1.1500 the figure .
  • Immediate contention should emerge at October’s low at 1.1430 ahead of the 200-week SMA, today at 1.1322.
  • The continuation of the down move is expected to meet the so far 2018 low at 1.1299 (August 15).

EUR/USD daily chart

EUR/USD

Overview:
    Last Price: 1.1447
    Daily change: -84 pips
    Daily change: -0.728%
    Daily Open: 1.1531
Trends:
    Daily SMA20: 1.1583
    Daily SMA50: 1.1582
    Daily SMA100: 1.1624
    Daily SMA200: 1.1911
Levels:
    Daily High: 1.154
    Daily Low: 1.1531
    Weekly High: 1.1611
    Weekly Low: 1.143
    Monthly High: 1.1816
    Monthly Low: 1.1526
    Daily Fibonacci 38.2%: 1.1479
    Daily Fibonacci 61.8%: 1.1498
    Daily Pivot Point S1: 1.1425
    Daily Pivot Point S2: 1.1398
    Daily Pivot Point S3: 1.1347
    Daily Pivot Point R1: 1.1504
    Daily Pivot Point R2: 1.1556
    Daily Pivot Point R3: 1.1583

Author

Pablo Piovano

Born and bred in Argentina, Pablo has been carrying on with his passion for FX markets and trading since his first college years.


More from Pablo Piovano
Share:

Editor's Picks

GBP/USD turns negative; slips back to 1.3530

GBP/USD comes under pressure and weakens toward the 1.3530 zone on Tuesday. Cable thus leaves behind two daily upticks in a row and retreats further from Monday’s multi-week tops past 1.3570 following humble gains in the Greenback and disheartening UK jobs data.

EUR/USD comes under pressure near 1.1570

EUR/USD could not sustain the earlier bullish attempt toward the proximity of 1.1600 the figure, coming under fresh downside pressure and revisiting the 1.1580-1.1570 band as the NA session draws to a close on Tuesday. The better tone in the US Dollar in the latter part of the day weighs on the pair amid steady volatility in the Middle East. Looking forward, the release of the FOMC Minutes takes centre stage on Wednesday.

Gold remains offered around $4,350

Gold accelerates its daily correction and revisits the $4,350 zone per troy ounce on Tuesday. The precious metal sets aside two daily advances in a row and follows the absence of direction in the US Dollar, declining US Treasury yields across the curve and continuous uncertainty in the Middle East crisis.

Bitcoin volatility falls below Nasdaq as market activity hits multi-year low

Bitcoin’s 30-day volatility has fallen below that of the Nasdaq for only the fifth time on record, as subdued trading activity and declining volumes point to an unusually quiet period, according to a Tuesday report from K33. BTC's 30-day volatility has dropped to 1.132%, marking its fourth-lowest reading of the 2020s. Seven-day volatility also dropped to 0.52%, its lowest level since 2023.

Fiscal concerns and doubts on Fed independence send US yields to long-term highs

US Treasury yields keep rising across the curve this week, with the yield for the 30-year Treasury bond reaching its highest level since 2007, during the global financial crisis, at 5.33% so far on Monday. A mix of concerns about the ballooning US fiscal deficit and growing doubts about the Federal Reserve’s Independence are increasing pressure on US Government Bonds.

Why is Crude Oil priced for a reopening the ships haven't made?
Fourteen vessels crossed the Strait of Hormuz on Tuesday. Before the war, the count ran near 120 a day. In the sessions since the waterway was publicly declared open, Brent has drifted back to $87 and West Texas Intermediate (WTI) to $81, both a little lower again on Wednesday, with daily momentum on each unwound from the top of its range in late July to the low twenties now.