|

EUR/USD technical analysis: Recent bull run currently capped at 1.1320 resistance

  • The US and Mexico reached a deal on tariffs and immigration, which is seen as positive for USD.
  • The European Central Bank is considering cutting interest rates to ramp up inflation.
  • The bank holiday in some European countries is keeping the volatility low. EUR/USD is essentially trading sideways this Monday.
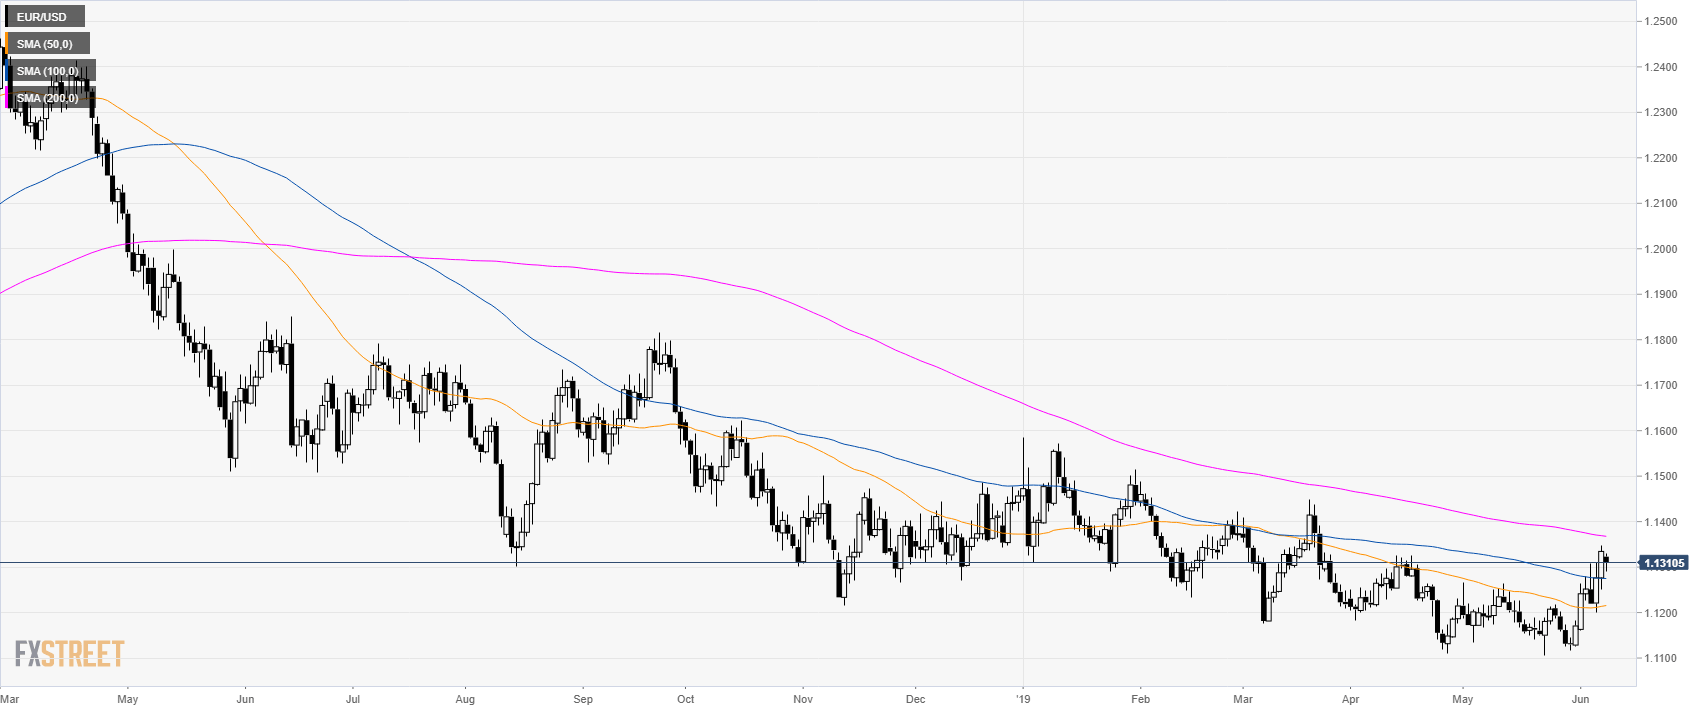
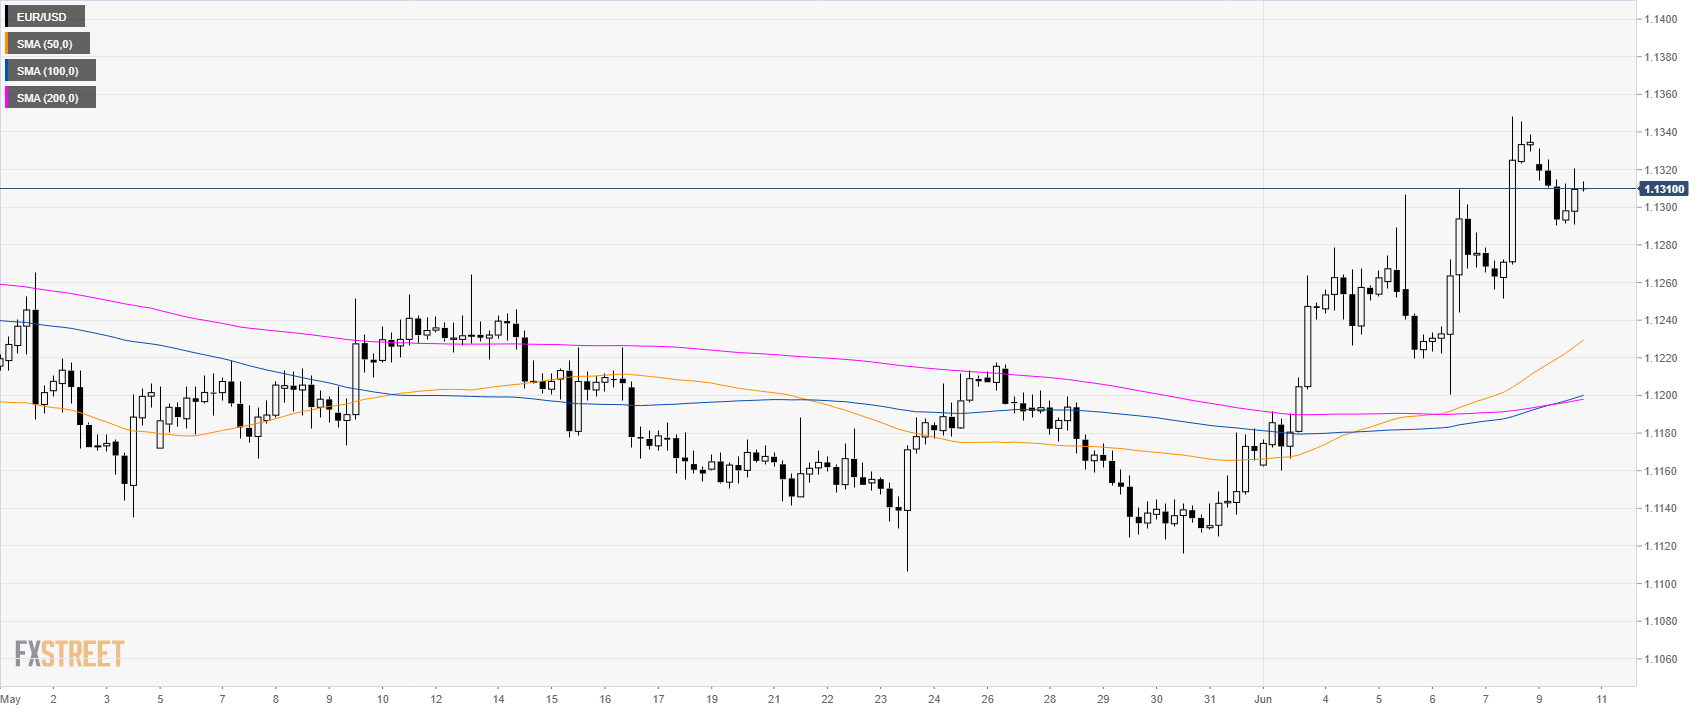

EUR/USD daily chart

EUR/USD is trading in a bear trend below its 200 simple moving averages (SMAs).

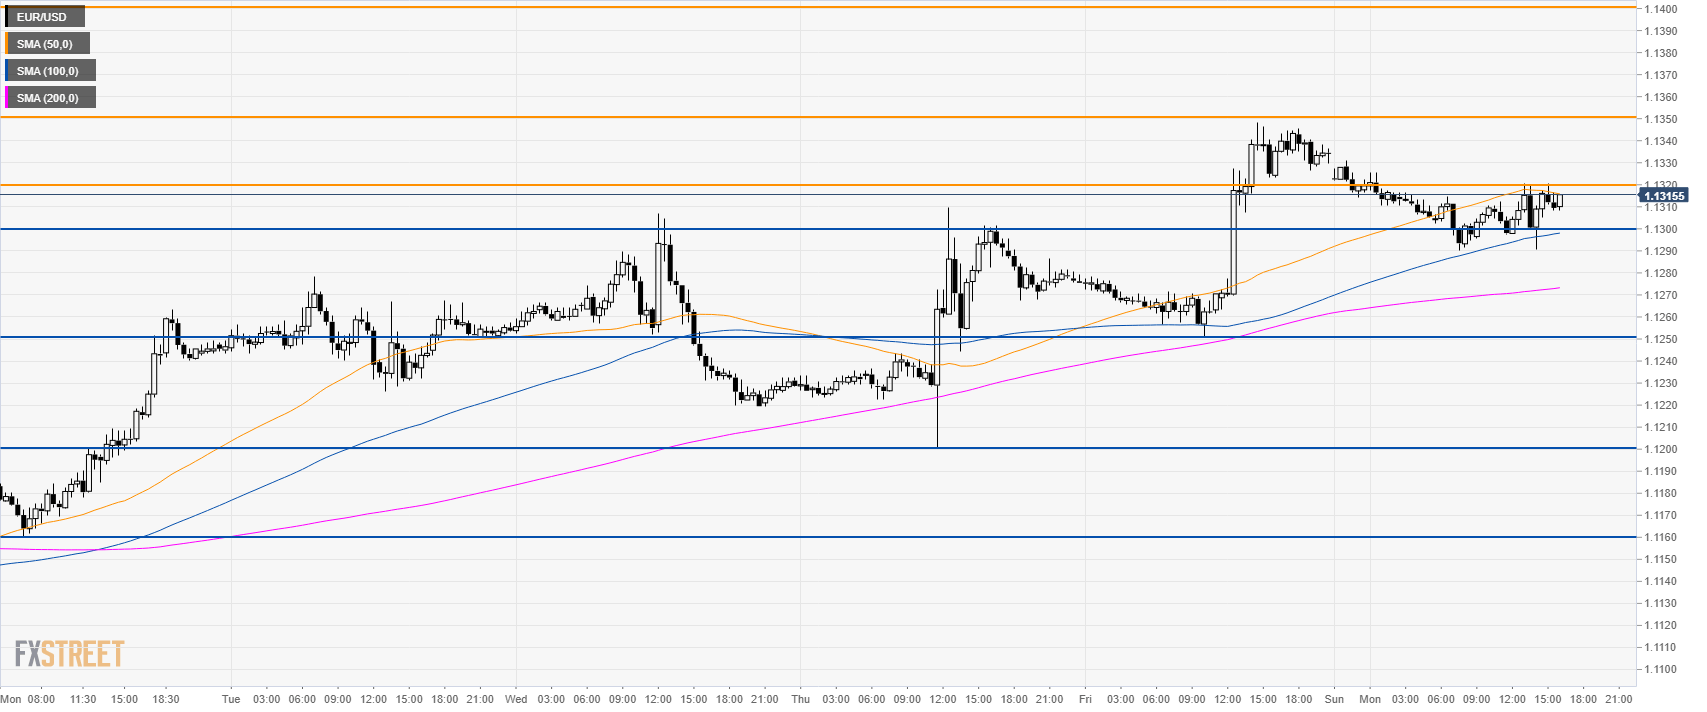
EUR/USD 4-hour chart
 

The market is testing 1.1320 resistance while trading above its main SMAs.


EUR/USD 30-minute chart

Fiber is consolidating below 1.1320 and the 50 SMA. It is trading above the 100 and 200 SMAs and a sustained break beyond 1.1320 is needed to reach 1.1400 handle. On the flip side, a daily close below 1.1250 would be seen as bearish.

Additional key levels

EUR/USD

Overview
Today last price1.1312
Today Daily Change-0.0022
Today Daily Change %-0.19
Today daily open1.1334
 
Trends
Daily SMA201.1198
Daily SMA501.1214
Daily SMA1001.1275
Daily SMA2001.1369
Levels
Previous Daily High1.1348
Previous Daily Low1.1251
Previous Weekly High1.1348
Previous Weekly Low1.116
Previous Monthly High1.1266
Previous Monthly Low1.1107
Daily Fibonacci 38.2%1.1311
Daily Fibonacci 61.8%1.1288
Daily Pivot Point S11.1274
Daily Pivot Point S21.1214
Daily Pivot Point S31.1177
Daily Pivot Point R11.1372
Daily Pivot Point R21.1409
Daily Pivot Point R31.1469

Author

Flavio Tosti

Flavio Tosti

Independent Analyst


More from Flavio Tosti
Share:

Editor's Picks

EUR/USD looks sidelined around 1.1850

EUR/USD remains on the back foot, extending its bearish tone and sliding towards the 1.1850 area to print fresh daily lows on Monday. The move lower comes as the US Dollar gathers modest traction, with thin liquidity and subdued volatility amplifying price swings amid the US market holiday.

GBP/USD flirts with daily lows near 1.3630

GBP/USD has quickly given back Friday’s solid gains, turning lower at the start of the week and drifting back towards the 1.3630 area. The focus now shifts squarely to Tuesday’s UK labour market report, which is likely to keep the quid firmly in the spotlight and could set the tone for Cable’s next move.

Gold loses momentum, eases below $5,000

Gold is giving back part of Friday’s sharp rebound, deflating below the key $5,000 mark per troy ounce as the new week gets underway. Modest gains in the US Dollar are keeping the metal in check, while thin trading conditions, due to the Presidents Day holiday in the US, are adding to the choppy and hesitant tone across markets.

Bitcoin consolidates as on-chain data show mixed signals

Bitcoin price has consolidated between $65,700 and $72,000 over the past nine days, with no clear directional bias. US-listed spot ETFs recorded a $359.91 million weekly outflow, marking the fourth consecutive week of withdrawals.

The week ahead: Key inflation readings and why the AI trade could be overdone

It is likely to be a quiet start to the week, with US markets closed on Monday for Presidents Day. European markets are higher across the board and gold is clinging to the $5,000 level after the tamer than expected CPI report in the US reduced haven flows to precious metals.

XRP steadies in narrow range as fund inflows, futures interest rise

Ripple is trading in a narrow range between $1.45 (immediate support) and $1.50 (resistance) at the time of writing on Monday. The remittance token extended its recovery last week, peaking at $1.67 on Sunday from the weekly open at $1.43.