|

EUR/USD technical analysis: Fiber eases from daily high, trades below 1.1050 into the London close

  • EUR/USD is erasing most of the gains made earlier in the London session. 
  • EUR/USD is trapped in a two-week range looking for a directional bias.
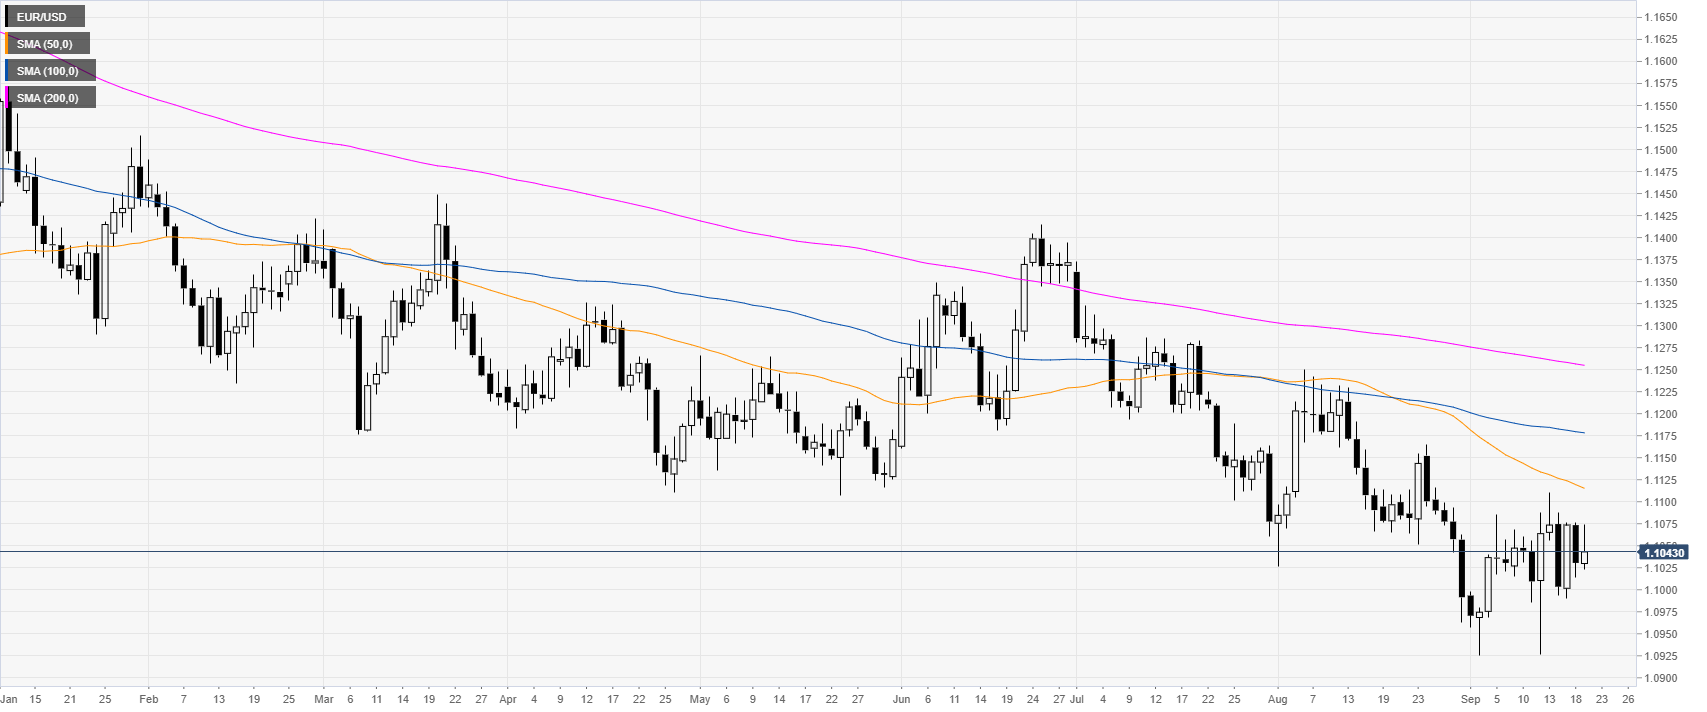
EUR/USD daily chart

 
The common currency, on the daily chart, is trading in a bear trend below its main daily simple moving averages (DSMAs). The Euro has been in a trading range over the last two weeks.

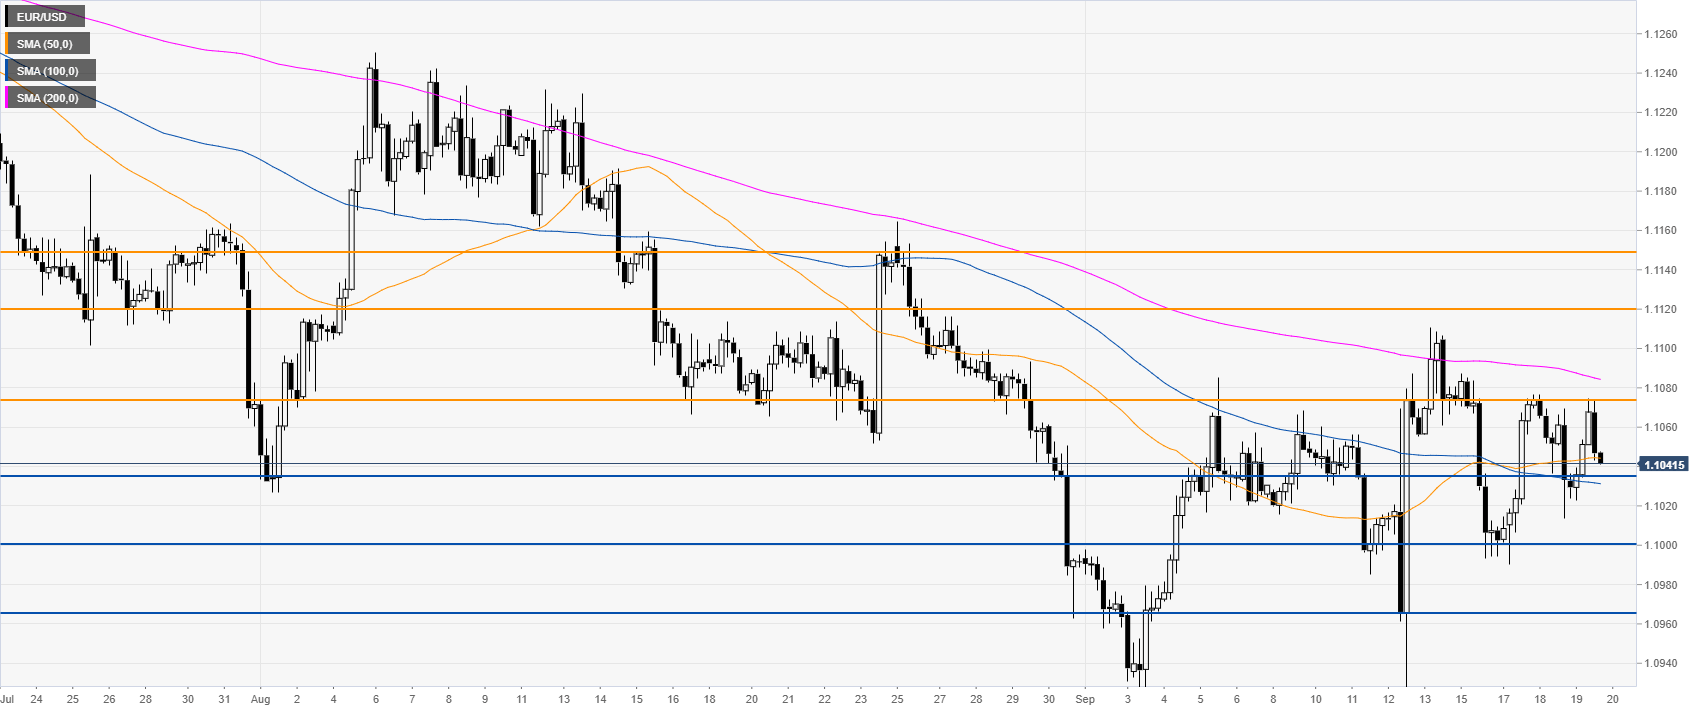
EUR/USD four-hour chart

 
EUR/USD is trading between the 100 and 200 SMA, suggesting a ranging market in the medium term. The spot is nearing the 1.1035 support. A break below this level is necessary for bears to reach 1.1000 and 1.0965 on the way down, according to the Technical Confluences Indicator


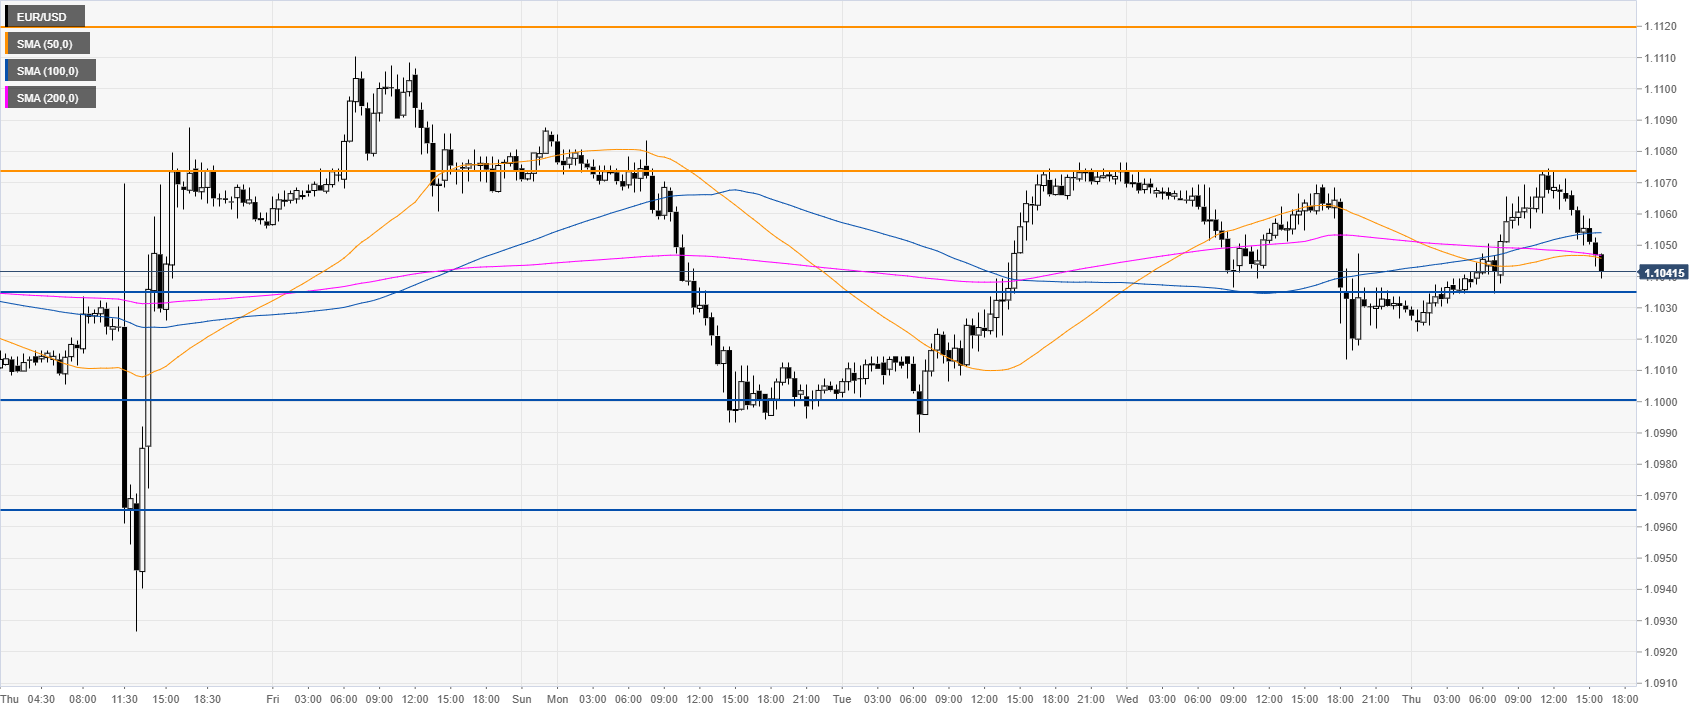
EUR/USD 30-minute chart

 
EUR/USD is erasing parts of the gains made earlier in the day. Resistance is seen at the 1.1074 and 1.1120 levels, according to the Technical Confluences Indicator.

Additional key levels

EUR/USD

Overview
Today last price1.1041
Today Daily Change0.0012
Today Daily Change %0.11
Today daily open1.1029
 
Trends
Daily SMA201.1047
Daily SMA501.1119
Daily SMA1001.118
Daily SMA2001.1256
 
Levels
Previous Daily High1.1075
Previous Daily Low1.1014
Previous Weekly High1.111
Previous Weekly Low1.0927
Previous Monthly High1.1251
Previous Monthly Low1.0962
Daily Fibonacci 38.2%1.1037
Daily Fibonacci 61.8%1.1051
Daily Pivot Point S11.1004
Daily Pivot Point S21.0978
Daily Pivot Point S31.0943
Daily Pivot Point R11.1065
Daily Pivot Point R21.11
Daily Pivot Point R31.1126

Author

Flavio Tosti

Flavio Tosti

Independent Analyst


More from Flavio Tosti
Share:

Editor's Picks

EUR/USD keeps the offered stance just above 1.1700

EUR/USD is coming under heavy selling pressure in what has been a rather grim start to the new trading week, with the pair now trading close to the 1.1700 support area as the US Dollar stages a solid rebound. The prevailing flight to safety mood continues to favour the Greenback, as investors react to the escalating conflict in the Middle East and trim risk exposure across the board.

GBP/USD hits new yearly lows near 1.3300

GBP/USD adds to the recent bearish tone, approaching to the key 1.3300 support to reach fresh YTD troughs against the backdrop of the robust performance of the US Dollar. Indeed, Cable’s decline comes amid the firm demand for the safe-haven space in the wake of the US and Israel attacks to Iran.

Gold trims losses, back below $5,400

Gold now surrenders part of the earlier advance past the $5,400 mark per troy ounce at the beginning of the week. Indeed, the precious metal’s strong uptick remains fuelled by increasing geopolitical tensions in the Middle East amid the intense demand for safer assets.

Bitcoin on brink of breakdown amid US-Iran war

Bitcoin (BTC) remains under pressure near the key support level of $65,700. Trading at $66,400 at the time of writing on Monday, a breakdown below this critical level would suggest a deeper correction ahead.

The Fed is finally talking about AI – Here's why it matters for the US Dollar

AI is moving from earnings calls into the heart of monetary policy discussions, forcing Federal Reserve officials to confront a new question: How to act if AI reshapes inflation, employment and interest rates at the same time?

Grass 20% bullish breakout defies broader market weakness

Grass (GRASS) is edging up above $0.30 at the time of writing on Monday. The token’s notable 20% intraday surge stands out amid heightened volatility in the broader crypto market.