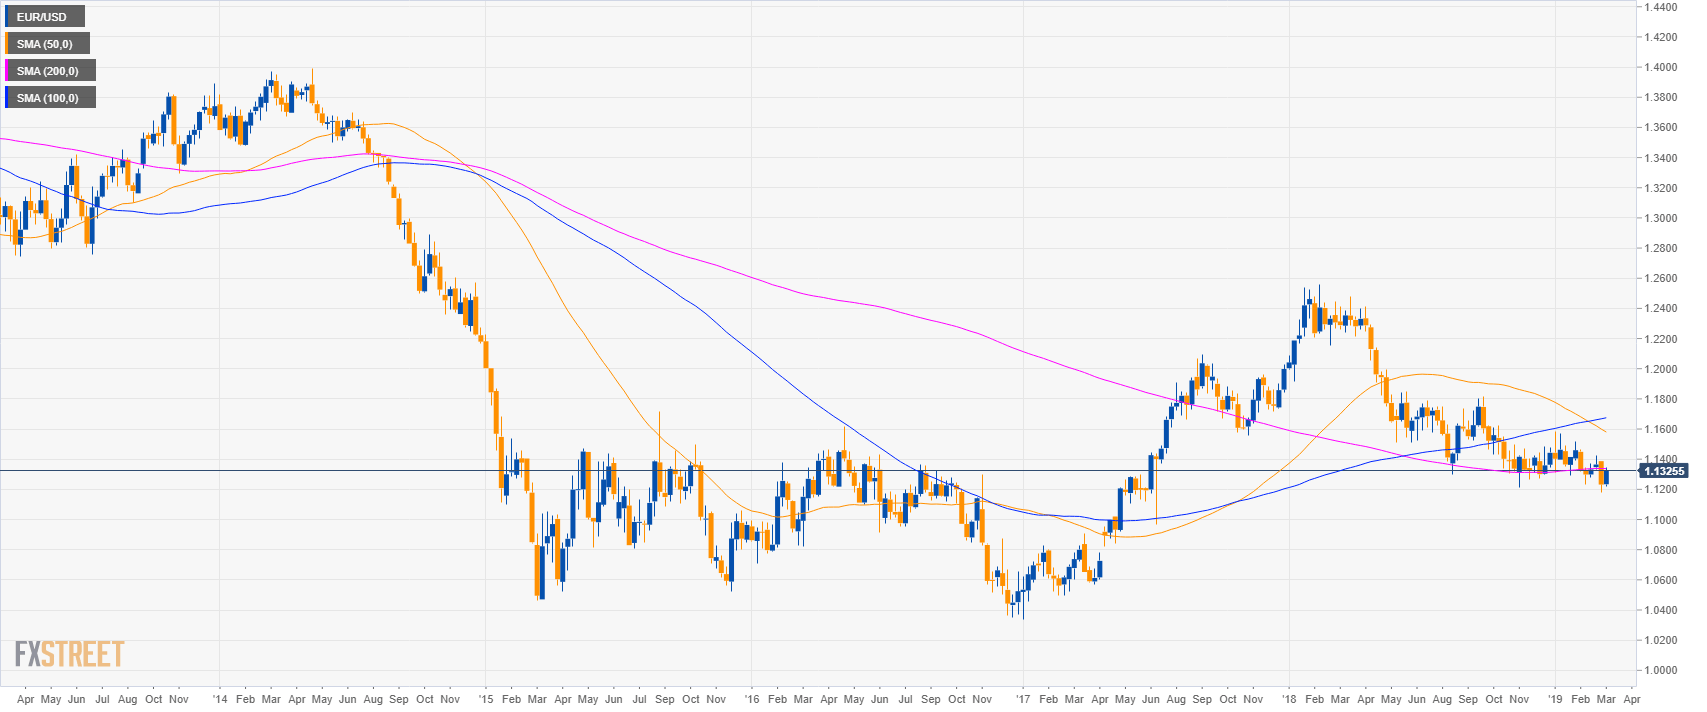
EUR/USD weekly chart
- EUR/USD is testing the 200-week simple moving average near the 1.1337 level.
- A break above 1.1337 would be significant.
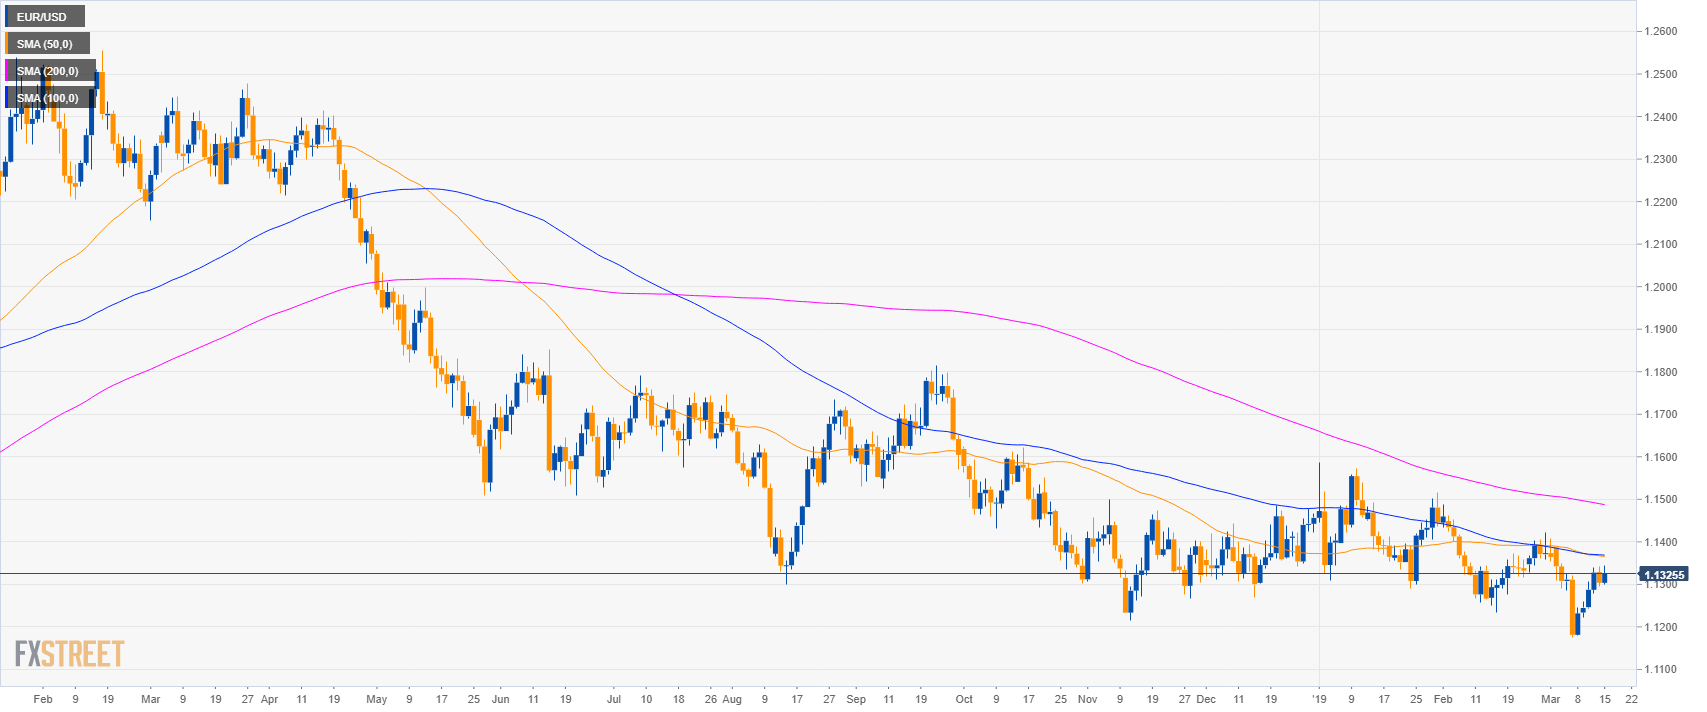
EUR/USD daily chart
- EUR/USD is trading in a bear trend below its main simple moving averages (SMAs).
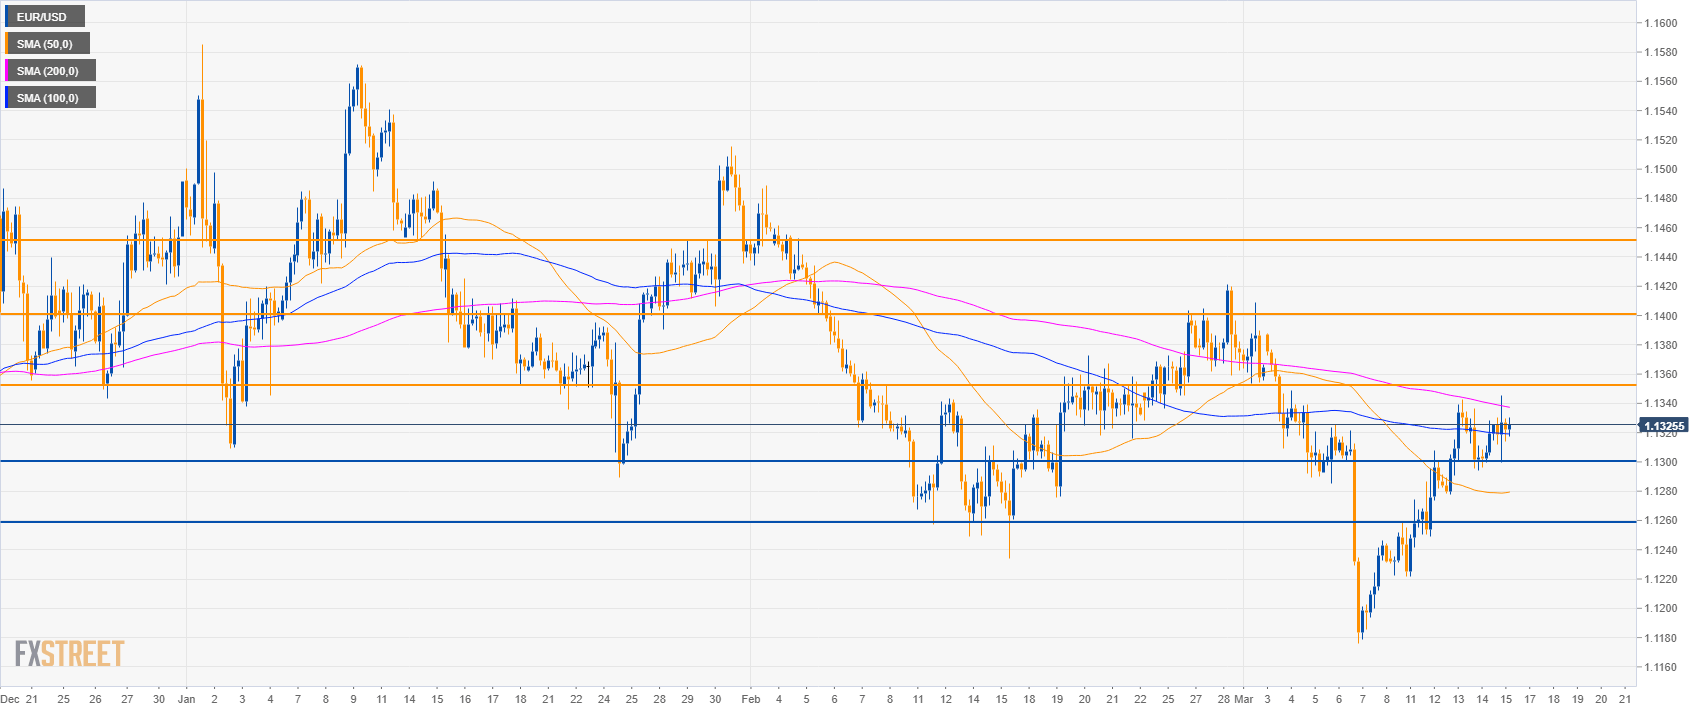
EUR/USD 4-hour chart
- EUR/USD is trading between the 100 and the 200 SMAs suggesting a consolidation phase.
- The key resistance to break for bulls is 1.1337/50 which can lead to 1.1400 figure.
- However, before that, the bears might have an attempt at 1.1300 and 1.1260 support.
Additional key levels
EUR/USD
Overview:
Today Last Price: 1.1326
Today Daily change: 22 pips
Today Daily change %: 0.19%
Today Daily Open: 1.1304
Trends:
Daily SMA20: 1.1318
Daily SMA50: 1.1367
Daily SMA100: 1.137
Daily SMA200: 1.149
Levels:
Previous Daily High: 1.1342
Previous Daily Low: 1.1294
Previous Weekly High: 1.1388
Previous Weekly Low: 1.1176
Previous Monthly High: 1.1489
Previous Monthly Low: 1.1234
Daily Fibonacci 38.2%: 1.1313
Daily Fibonacci 61.8%: 1.1324
Daily Pivot Point S1: 1.1284
Daily Pivot Point S2: 1.1265
Daily Pivot Point S3: 1.1236
Daily Pivot Point R1: 1.1333
Daily Pivot Point R2: 1.1362
Daily Pivot Point R3: 1.1381
Note: All information on this page is subject to change. The use of this website constitutes acceptance of our user agreement. Please read our privacy policy and legal disclaimer. Opinions expressed at FXstreet.com are those of the individual authors and do not necessarily represent the opinion of FXstreet.com or its management. Risk Disclosure: Trading foreign exchange on margin carries a high level of risk, and may not be suitable for all investors. The high degree of leverage can work against you as well as for you. Before deciding to invest in foreign exchange you should carefully consider your investment objectives, level of experience, and risk appetite. The possibility exists that you could sustain a loss of some or all of your initial investment and therefore you should not invest money that you cannot afford to lose. You should be aware of all the risks associated with foreign exchange trading, and seek advice from an independent financial advisor if you have any doubts.
Recommended content
Editors’ Picks
AUD/USD posts gain, yet dive below 0.6500 amid Aussie CPI, ahead of US GDP
The Aussie Dollar finished Wednesday’s session with decent gains of 0.15% against the US Dollar, yet it retreated from weekly highs of 0.6529, which it hit after a hotter-than-expected inflation report. As the Asian session begins, the AUD/USD trades around 0.6495.
USD/JPY finds its highest bids since 1990, approaches 156.00
USD/JPY broke into its highest chart territory since June of 1990 on Wednesday, peaking near 155.40 for the first time in 34 years as the Japanese Yen continues to tumble across the broad FX market.
Gold stays firm amid higher US yields as traders await US GDP data
Gold recovers from recent losses, buoyed by market interest despite a stronger US Dollar and higher US Treasury yields. De-escalation of Middle East tensions contributed to increased market stability, denting the appetite for Gold buying.
Ethereum suffers slight pullback, Hong Kong spot ETH ETFs to begin trading on April 30
Ethereum suffered a brief decline on Wednesday afternoon despite increased accumulation from whales. This follows Ethereum restaking protocol Renzo restaked ETH crashing from its 1:1 peg with ETH and increased activities surrounding spot Ethereum ETFs.
Dow Jones Industrial Average hesitates on Wednesday as markets wait for key US data
The DJIA stumbled on Wednesday, falling from recent highs near 38,550.00 as investors ease off of Tuesday’s risk appetite. The index recovered as US data continues to vex financial markets that remain overwhelmingly focused on rate cuts from the US Fed.