|
EUR/USD price analysis: Euro eases from daily highs post-US ISM Non-Manufacturing PMI
- EUR/USD trades near 1.1093 resistance after disappointing US Data.
- The level to beat for buyers is the 1.1093 resistance.
- US ISM Non-Manufacturing PMI adds another miss, USD slide continues.

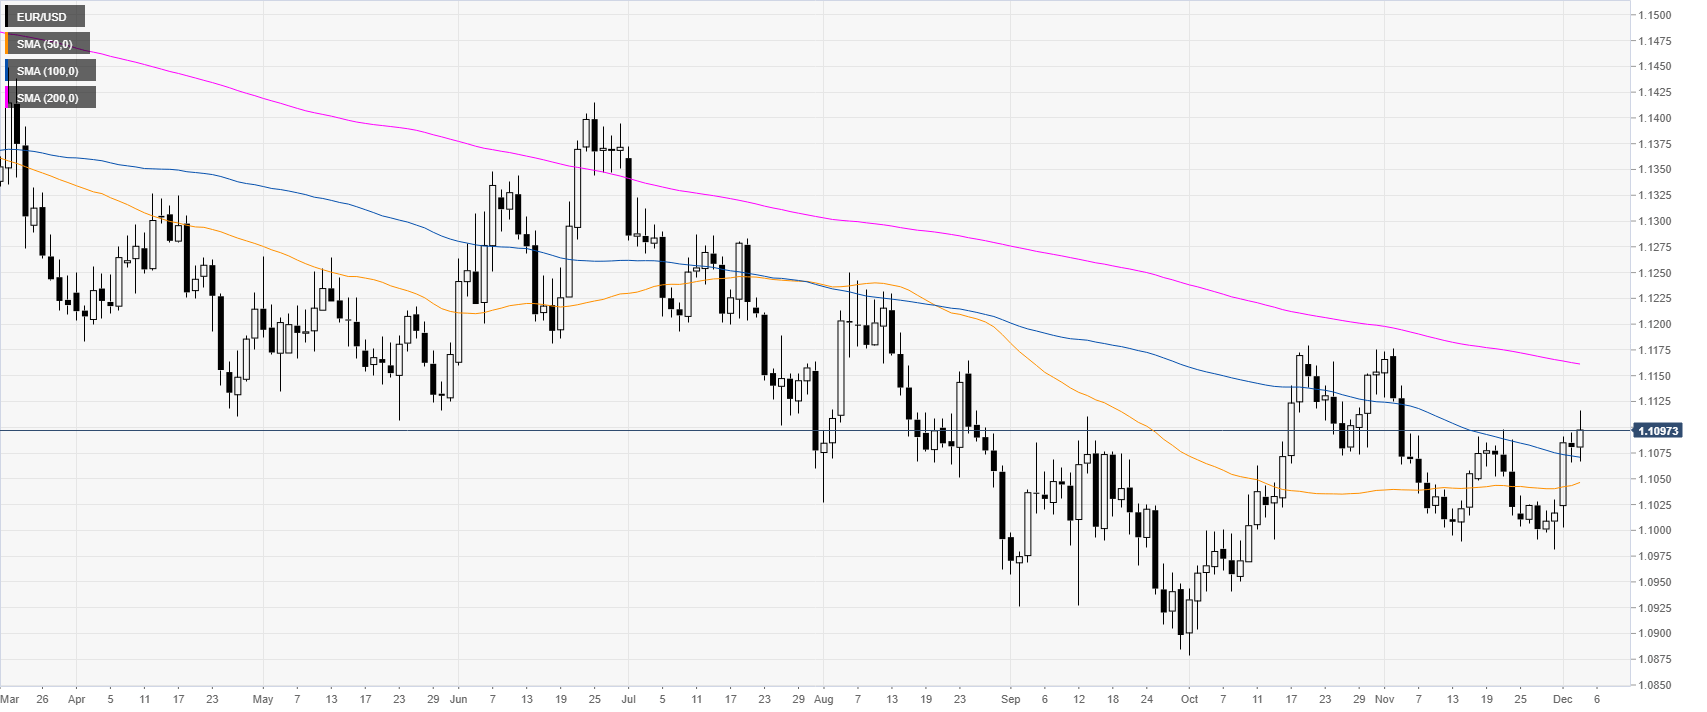
EUR/USD daily chart
EUR/USD on the daily chart is trading in a bear trend below the 200-day simple moving average (DMA). However, the market is trying to gain upside momentum above the 50/100 SMAs.
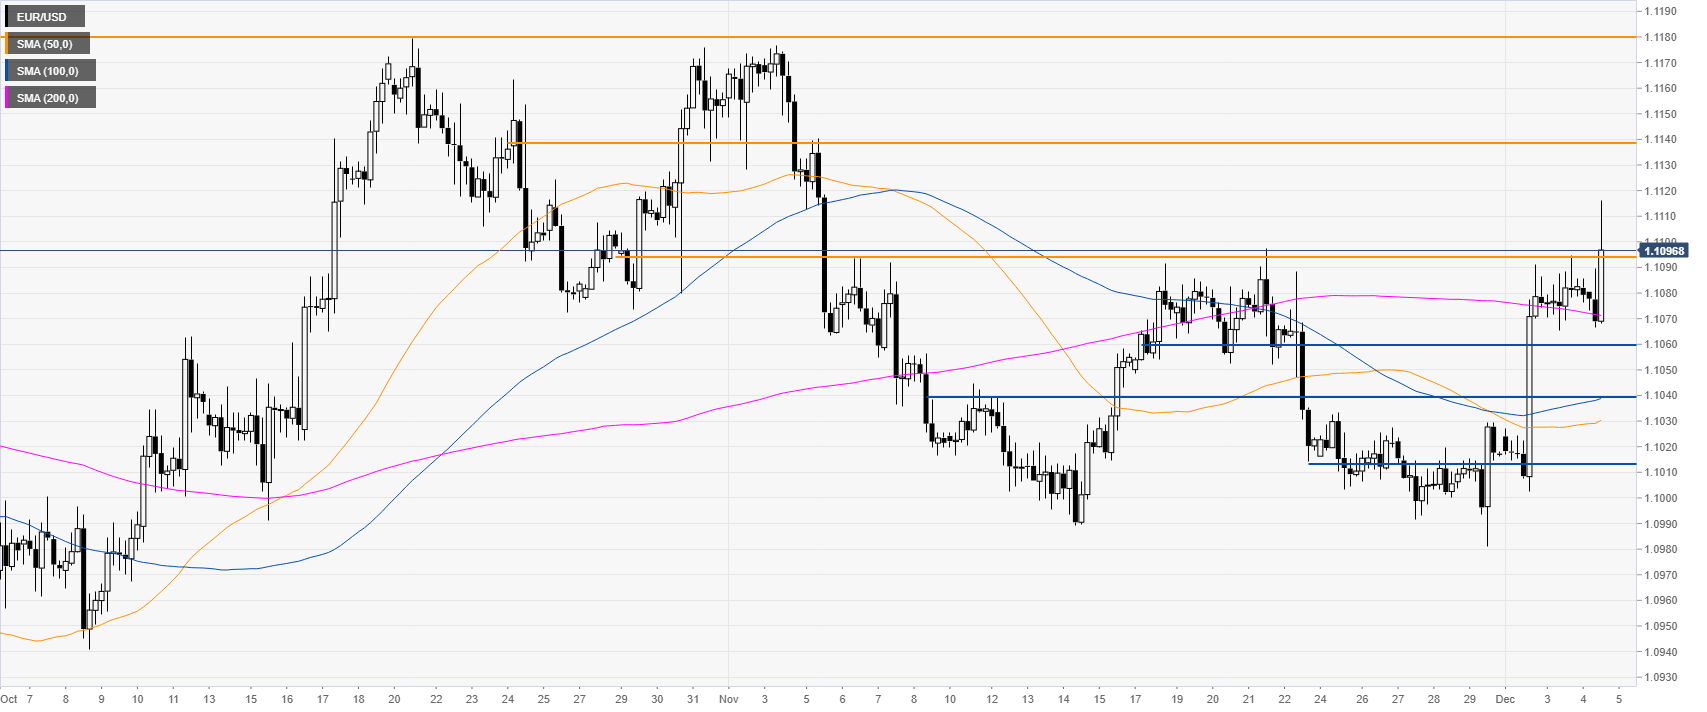
EUR/USD four-hour chart
EUR/USD is trying to break above the 1.1093 resistance while trading above the 200 SMA. If the spot can overcome this key resistance, EUR/USD could continue to move up towards the 1.1139 level and to 1.1180 if the buyers gather enough steam, according to the Technical Confluences Indicator.
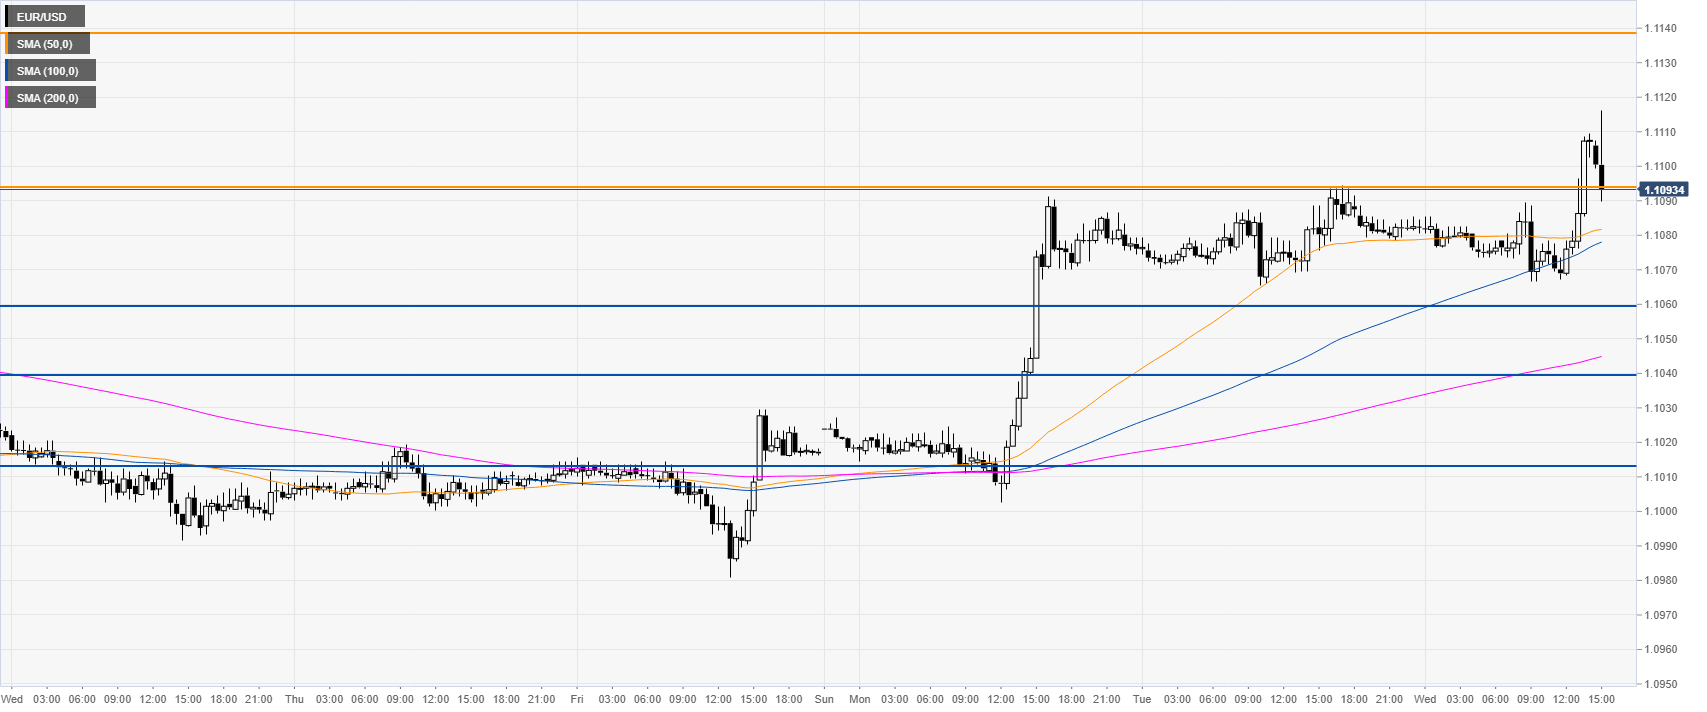
EUR/USD 30-minute chart
The spot is trading above its main SMAs, suggesting bullish momentum in the near term. Support can be seen at the 1.1059, 1.1040 and 1.1013 price levels, according to the Technical Confluences Indicator.
Additional key levels
Author

Flavio Tosti
Independent Analyst
More from Flavio Tosti


