|

EUR/USD technical analysis: Euro down as New York session kicks in, bounces from the 1.1000 handle

  • EUR/USD is under pressure in the New York session trading at its lowest since last Friday. 
  • The level to beat for bears is the 1.1000 handle. 
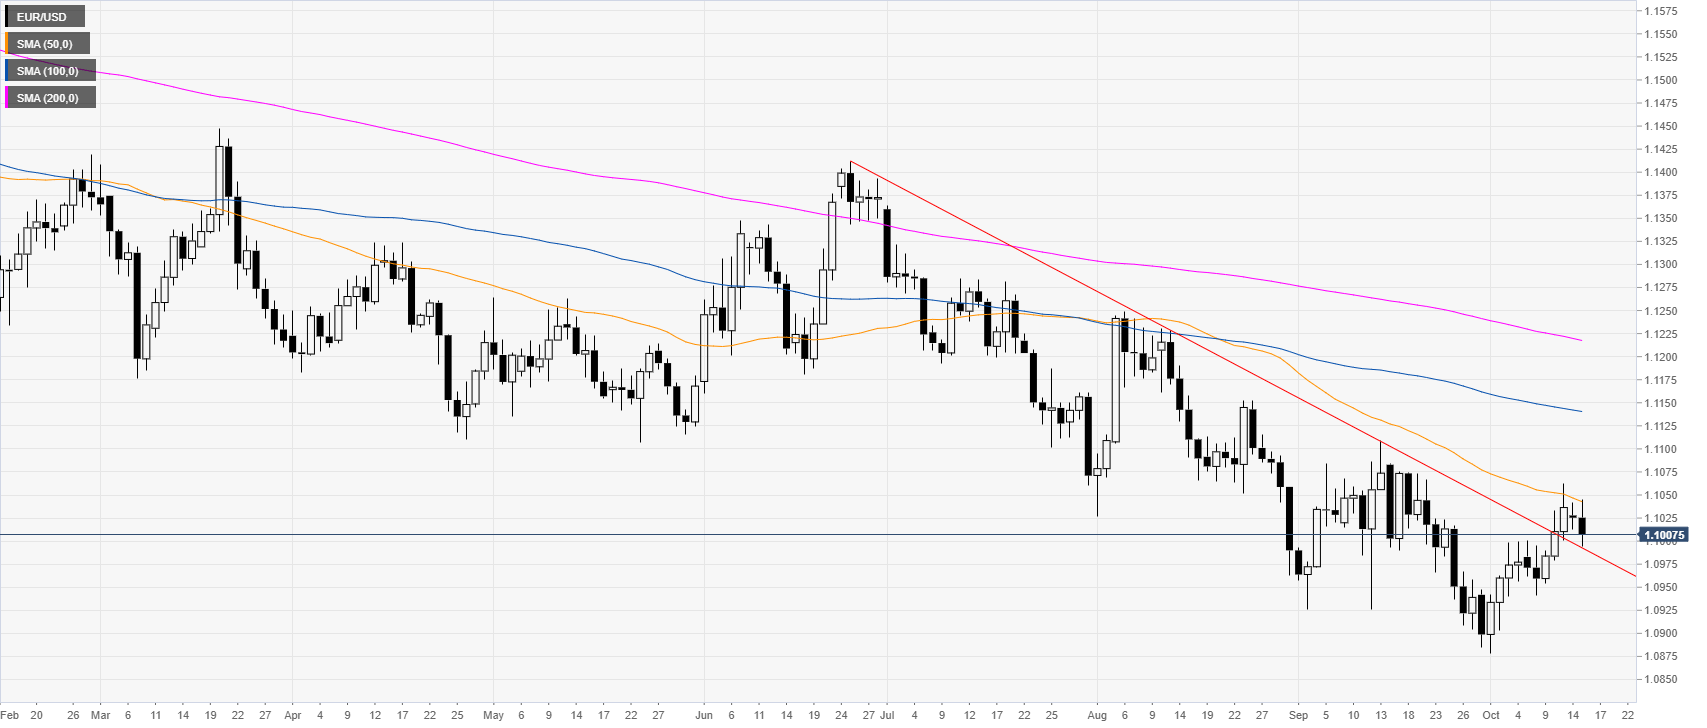
 

EUR/USD daily chart


On the daily chart, the common currency is trading in a bear trend below its main simple moving averages (DSMAs). However, last week, the Fiber broke above a multi-week trendline. Earlier in the Europen session, the German Zew survey came better-than-expected at -22.8 vs -27 for October.
 

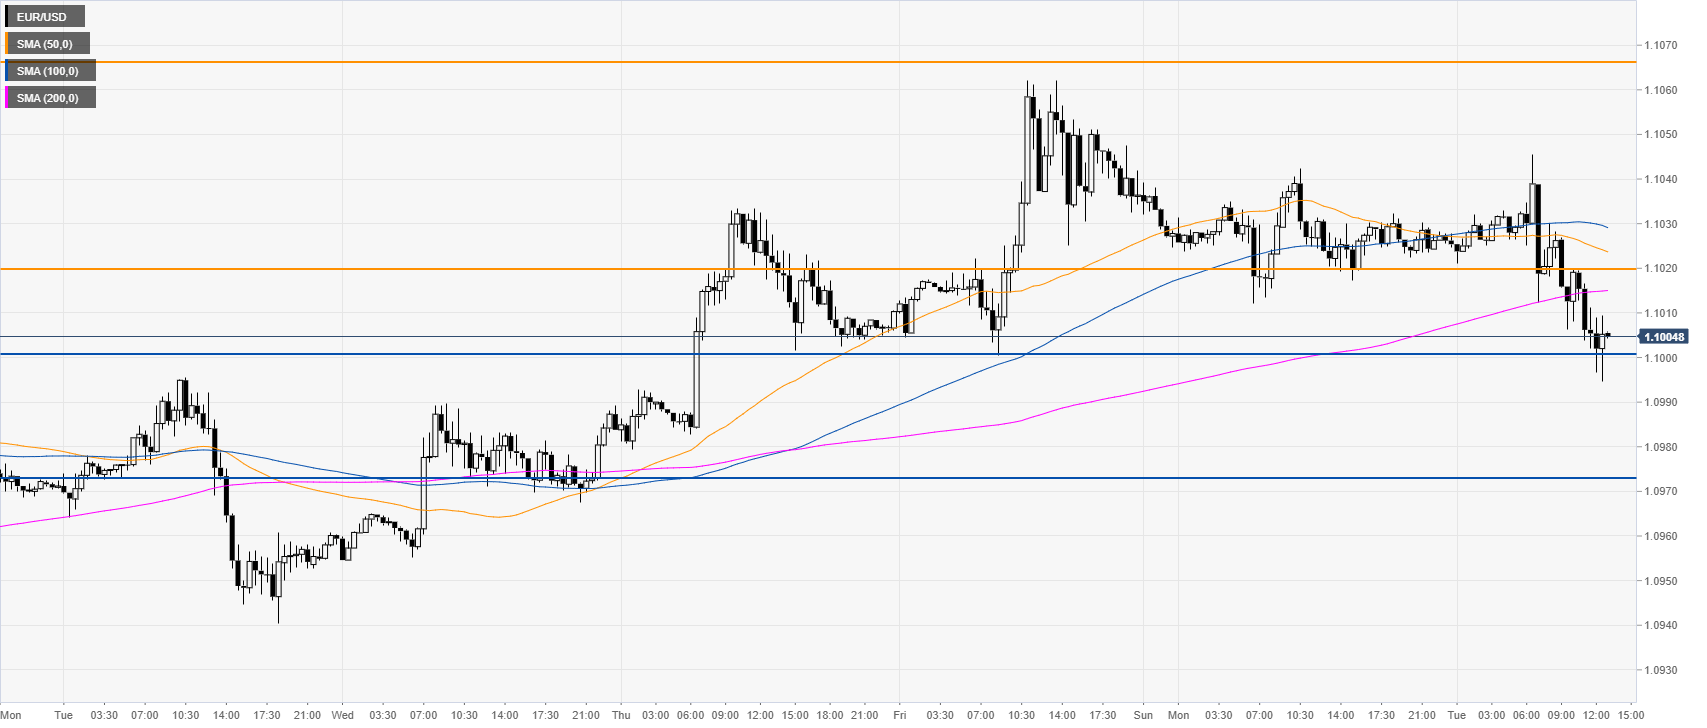
EUR/USD four-hour chart


The Euro is trading above the main SMAs, suggesting bullish momentum in the medium term. EUR/USD is consolidating last week’s gains above the 1.1000 figure and the 200 SMA. The 1.1025 resistance is the level to beat for bulls if they intend to reach the 1.1067 resistance on the way up, according to the Technical Confluences Indicator.
 

EUR/USD 30-minute chart


The Fiber is under pressure below its main SMAs. However, a daily close below the 1.1000 handle would be a stronger confirmation that the short term bias might have switched to bearish.

Additional key levels 

EUR/USD

Overview
Today last price1.1005
Today Daily Change-0.0021
Today Daily Change %-0.19
Today daily open1.1026
 
Trends
Daily SMA201.0986
Daily SMA501.1046
Daily SMA1001.1141
Daily SMA2001.1219
 
Levels
Previous Daily High1.1043
Previous Daily Low1.1013
Previous Weekly High1.1063
Previous Weekly Low1.0941
Previous Monthly High1.111
Previous Monthly Low1.0885
Daily Fibonacci 38.2%1.1024
Daily Fibonacci 61.8%1.1031
Daily Pivot Point S11.1011
Daily Pivot Point S21.0997
Daily Pivot Point S31.0981
Daily Pivot Point R11.1042
Daily Pivot Point R21.1057
Daily Pivot Point R31.1072

Author

Flavio Tosti

Flavio Tosti

Independent Analyst


More from Flavio Tosti
Share:

Editor's Picks

EUR/USD deflates to fresh lows, targets 1.1600

The selling pressure on EUR/USD now gathers extra pace, prompting the pair to hit fresh multi-week lows in the 1.1625-1.1620 band on Friday. The continuation of the downward bias comes in response to further gains in the US Dollar as market participants continue to assess the mixed release of US Nonfarm Payrolls in December.

GBP/USD breaks below 1.3400, challenges the 200-day SMA

GBP/USD remains under heavy fire and retreats for the fourth consecutive day on Friday. Indeed, Cable suffers the strong performance of the Greenback, intensified post-mixed NFP, and trades at shouting distance from its critical 200-day SMA near 1.3380.

Gold flirts with yearly tops around $4,500

Gold keeps its positive bias on Friday, adding to Thursday’s advance and challenging yearly highs in the $4,500 region per troy ounce. The risk-off sentiment favours the yellow metal despite the firmer tone in the Greenback and rising US Treasury yields.

Crypto Today: Bitcoin, Ethereum, XRP risk further decline as market fear persists amid slowing demand

Bitcoin holds $90,000 but stays below the 50-day EMA as institutional demand wanes. Ethereum steadies above $3,000 but remains structurally weak due to ETF outflows. XRP ETFs resume inflows, but the price struggles to gain ground above key support.

Week ahead – US CPI might challenge the geopolitics-boosted Dollar

Geopolitics may try to steal the limelight from US data. A possible US Supreme Court ruling on tariffs could dictate market movements. A crammed data calendar next week, US CPI comes on Tuesday; Fedspeak to intensify.

XRP trades under pressure amid weak retail demand

XRP presses down on the 50-day EMA support as risk-averse sentiment spreads despite a positive start to 2026. XRP faces declining retail demand, as reflected in futures Open Interest, which has fallen to $4.15 billion.