|

EUR/USD technical analysis: Euro clings to daily gains above 1.0926 level

  • EUR/USD is rolling into the Asian session near daily highs. 
  • The level to beat for bulls is the 1.0940 resistance.
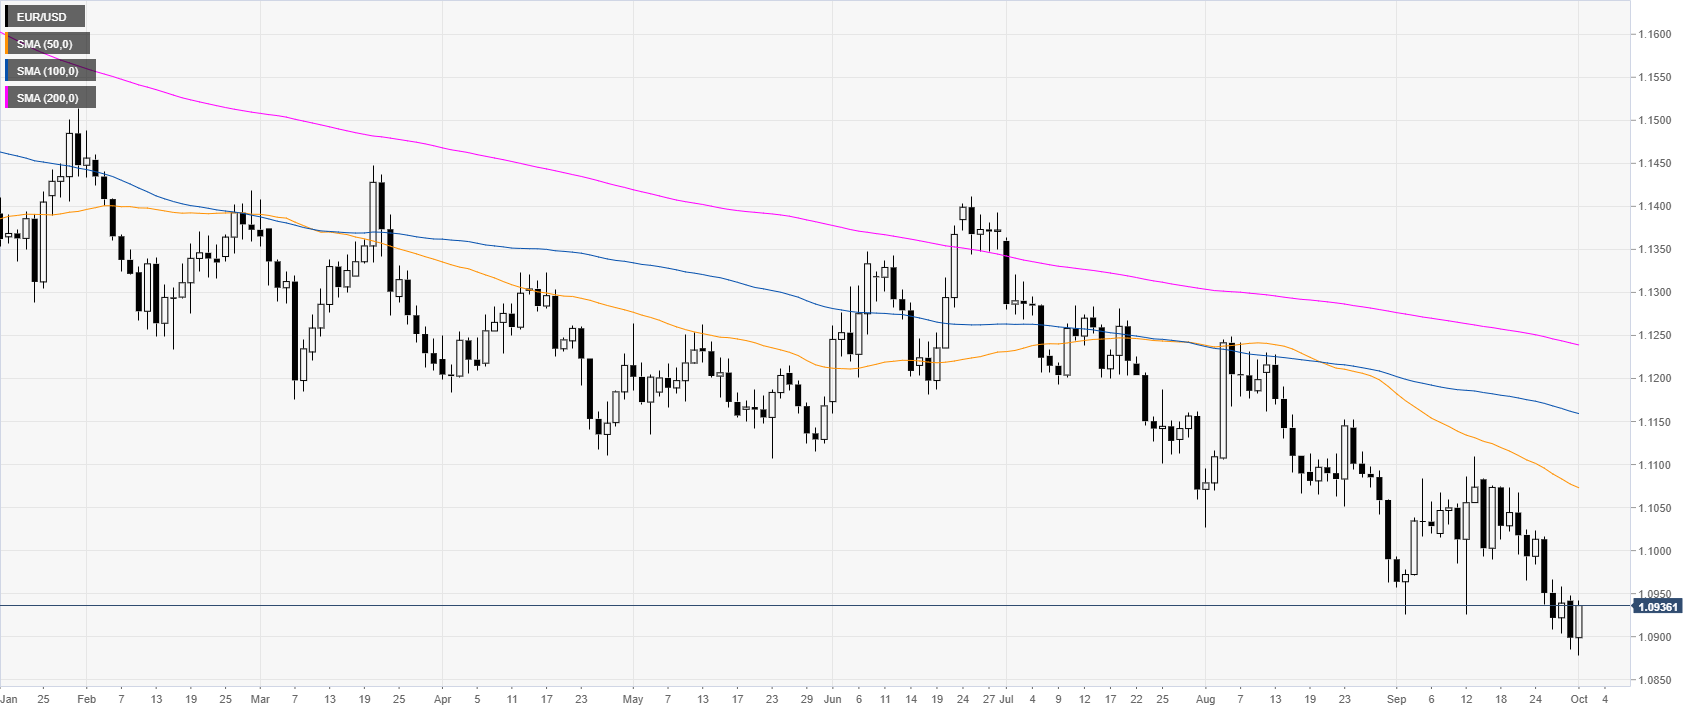
 

EUR/USD daily chart


The shared currency, on the daily chart, is trading in a bear trend below its main daily simple moving averages (DSMAs). This Tuesday, the ISM Manufacturing PMI dropped to 10-year low at 47.8 vs. 50.1 expected in September. 
 

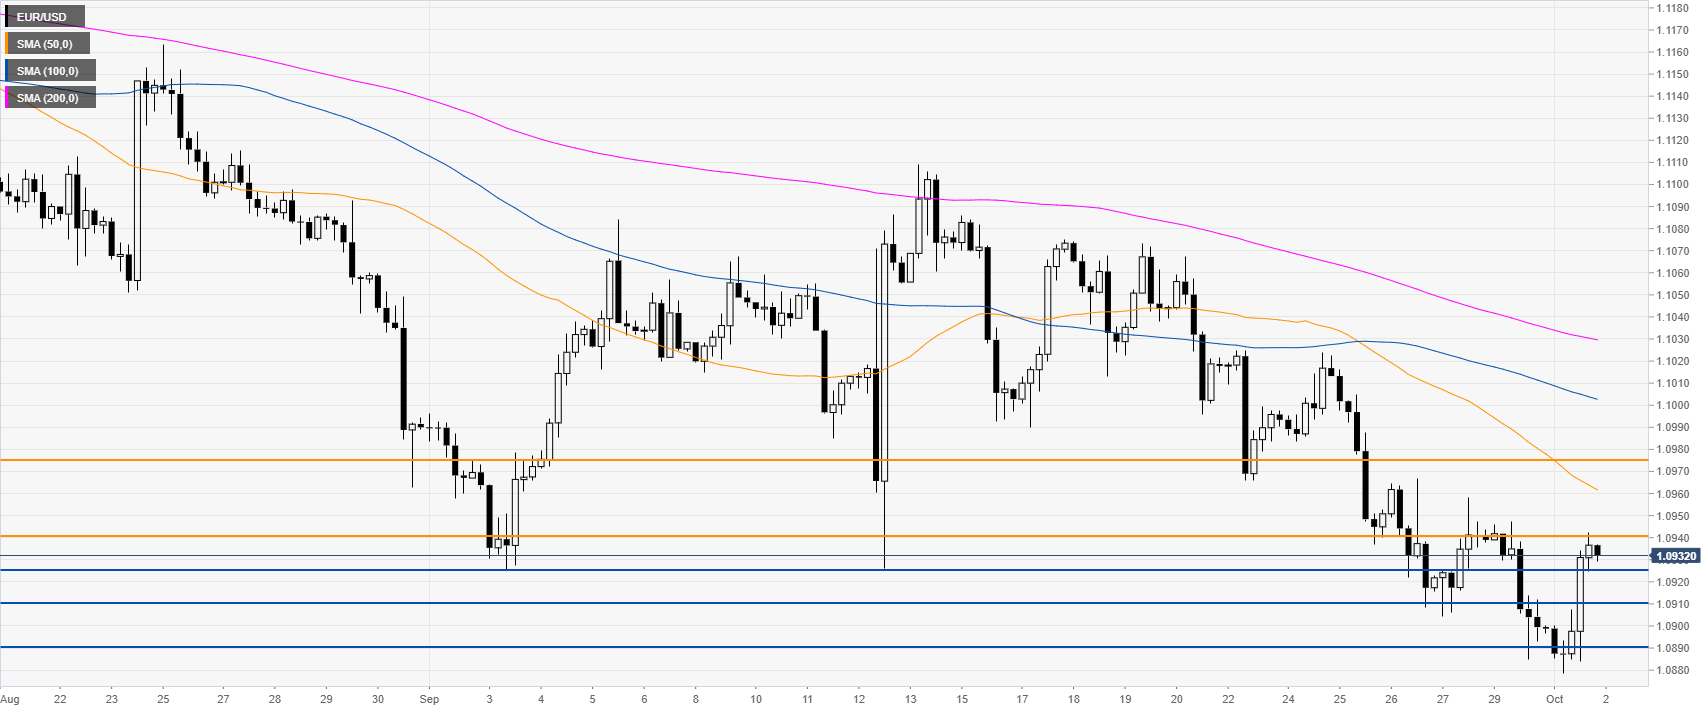
EUR/USD four-hour chart


EUR/USD is trading below the main SMAs, suggesting a bearish bias in the medium term. However, a break of 1.0940 can expose the 1.0975 resistance, according to the Technical Confluences Indicator

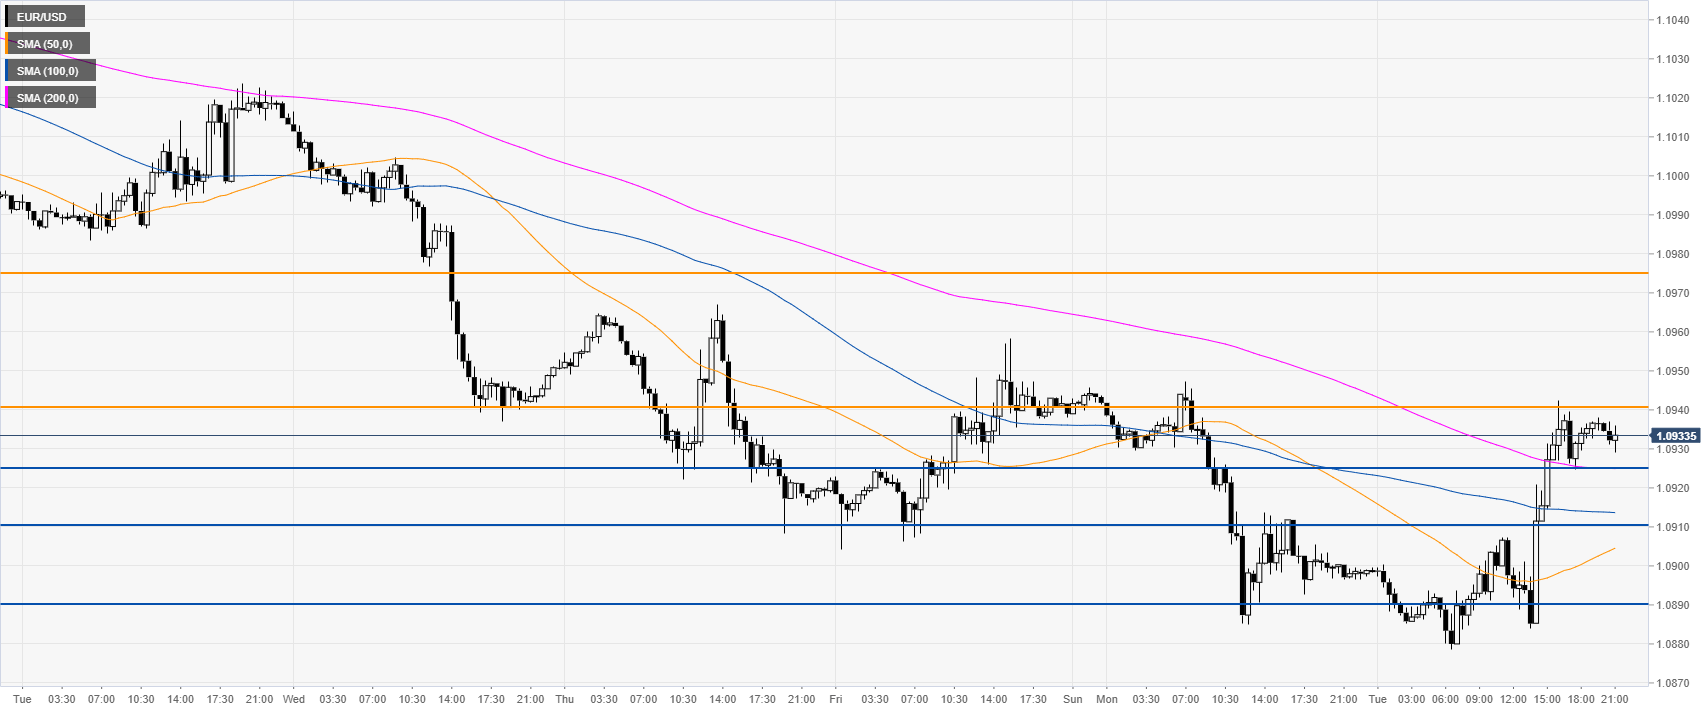
EUR/USD 30-minute chart


EUR/USD is trading above the main SMAs, suggesting bullish momentum in the near term. Immediate support is seen at the 1.0926 level followed by 1.0910 and 1.0890 level, according to the Technical Confluences Indicator. 
 

Additional key levels

EUR/USD

Overview
Today last price1.0931
Today Daily Change0.0032
Today Daily Change %0.29
Today daily open1.0899
 
Trends
Daily SMA201.101
Daily SMA501.1076
Daily SMA1001.1161
Daily SMA2001.1241
 
Levels
Previous Daily High1.0948
Previous Daily Low1.0885
Previous Weekly High1.1026
Previous Weekly Low1.0905
Previous Monthly High1.111
Previous Monthly Low1.0885
Daily Fibonacci 38.2%1.0909
Daily Fibonacci 61.8%1.0924
Daily Pivot Point S11.0874
Daily Pivot Point S21.0849
Daily Pivot Point S31.0812
Daily Pivot Point R11.0936
Daily Pivot Point R21.0973
Daily Pivot Point R31.0999

Author

Flavio Tosti

Flavio Tosti

Independent Analyst


More from Flavio Tosti
Share:

Editor's Picks

EUR/USD flat lines near 1.1800 as traders brace for US PPI release

The EUR/USD pair trades on a flat note near 1.1800 during the early Asian session on Friday. The pair steadies as softer Eurozone inflation offsets US tariff uncertainties. Traders await the preliminary reading of the Consumer Price Index from Germany on Friday for more clues about the pace of future policy easing. On the US front, the Producer Price Index report will be released. 

GBP/USD threatens the 200-day SMA near 1.3440

GBP/USD rapidly leaves behind Wednesday’s strong advance, coming under heavy pressure and retesting the 1.3440 zone, where the critical 200-day SMA is located. Cable’s deep pullback follows the strong gains in the Greenback, while investors continue to pencil in a potential BoE rate cut in March.

Gold awaits acceptance above $5,200 and US PPI data

Gold consolidates previous rebound near $5,200 amid risk-off markets, awaiting US PPI release. The US Dollar eyes a flattish weekly close as dovish Fed outlook and tariff woes outweigh geopolitical risks. Gold yearns for acceptance above $5,200 to resume the uptrend, with a bullish RSI in play.

Top Crypto Gainers: Stable and Decred rally, Pippin approaches record highs

Altcoins, such as Stable, Decred, and Pippin, are extending gains so far this week, defying the risk-averse conditions in the broader cryptocurrency market. Stable and Pippin are near record high levels, while Decred extends its breakout rally above $30.

Changing the game: International implications of recent tariff developments

The Supreme Court ruling on International Emergency Economic Powers Act (IEEPA) tariffs provides limited relief for the rest of the world, with weighted average tariff rates modestly lower.

Bitcoin steadies as traders eye US–Iran talks

Bitcoin (BTC) price is stabilizing around $68,000 at the time of writing on Thursday after a 6.2% relief rally the previous day amid a broader downward trend.