EUR/USD slides against a firmer US Dollar with US data on focus
- The Euro retreats from recent highs as the US Dollar picks up on risk aversion.
- The higher-than-expected Eurozone inflation data has failed to support the Euro.
- The US Dollar regains lost ground ahead of key US business activity and employment data releases

The EUR/USD pair is putting an end to a five-day positive streak on Tuesday, and extends losses from Monday's highs at 1.1735, reaching lows near 1.1630 ahead of the US session opening. The risk-averse sentiment is fuelling a US Dollar pickup that has been undaunted by the Eurozone's hotter-than-expected Consumer Prices Index (CPI) release.
Eurozone inflation edged up to a 2.1% yearly rate in August against market expectations of a steady 2% reading, and the core CPI remained unchanged at a 2.2% year-on-year rate. Market analysts had forecasted a slight moderation to 2.2%. These figures provide further reasons for the European Central Bank (ECB) to keep rates unchanged at next week's meeting.
The US Dollar, on the other hand, is posting a solid comeback after the last few days' decline, with US markets opening after a long weekend, due to the Labour Day bank holiday.
Later today, the US ISM Manufacturing Purchasing Manager's Index (PMI) will open a busy weekly calendar which closes with a key Nonfarm Payrolls report on Friday, with the Federal Reserve's (Fed) monetar ypolicy meeting around the corner.
Euro Price Today
The table below shows the percentage change of Euro (EUR) against listed major currencies today. Euro was the strongest against the British Pound.
| USD | EUR | GBP | JPY | CAD | AUD | NZD | CHF | |
|---|---|---|---|---|---|---|---|---|
| USD | 0.70% | 1.11% | 0.95% | 0.17% | 0.67% | 0.85% | 0.64% | |
| EUR | -0.70% | 0.40% | 0.29% | -0.52% | -0.00% | 0.15% | -0.06% | |
| GBP | -1.11% | -0.40% | -0.12% | -0.92% | -0.42% | -0.26% | -0.46% | |
| JPY | -0.95% | -0.29% | 0.12% | -0.78% | -0.29% | -0.09% | -0.27% | |
| CAD | -0.17% | 0.52% | 0.92% | 0.78% | 0.47% | 0.70% | 0.46% | |
| AUD | -0.67% | 0.00% | 0.42% | 0.29% | -0.47% | 0.17% | -0.05% | |
| NZD | -0.85% | -0.15% | 0.26% | 0.09% | -0.70% | -0.17% | -0.21% | |
| CHF | -0.64% | 0.06% | 0.46% | 0.27% | -0.46% | 0.05% | 0.21% |
The heat map shows percentage changes of major currencies against each other. The base currency is picked from the left column, while the quote currency is picked from the top row. For example, if you pick the Euro from the left column and move along the horizontal line to the US Dollar, the percentage change displayed in the box will represent EUR (base)/USD (quote).
Daily digest market movers: The US Dollar might remain vulnerable ahead of key data
- The Euro (EUR) is pulling back on Tuesday, remaining within the last four weeks' trading range. Trump's attacks on the Fed and market expectations that the US central bank will cut interest rates later in September are likely to limit the USD's upside attempts, while solid Eurozone macroeconomic figures and hawkish ECB rhetoric are likely to underpin the Euro.
- ECB board member Isabel Schnabel affirmed on Tuesday that interest rates are "mildly accommodative" at the moment and sees no reason for further monetary easing in the near term.
- On Monday, ECB President Christine Lagarde provided further support to the Euro, dismissing concerns about the French banking system and affirming that economic uncertainty has been "considerably reduced" in a speech suggesting that monetary policy will remain unchanged after September's meeting.
- Recent Eurozone data support that view, as the Eurozone HCOB Manufacturing Purchasing Managers' Index (PMI) was revised up to 50.7, from the 50.5 previous estimate, confirming that the sector's activity expanded in August for the first time in the last three years.
- In the US, the main attraction will be the ISM Manufacturing PMI due at 14:00 GMT, still, which is forecasted to have improved to 49 in August, from 48 in July, still at levels pointing to a contraction of the sector's activity.
Technical Analysis: EUR/USD remains in range, with 1.1740 resistance holding bulls
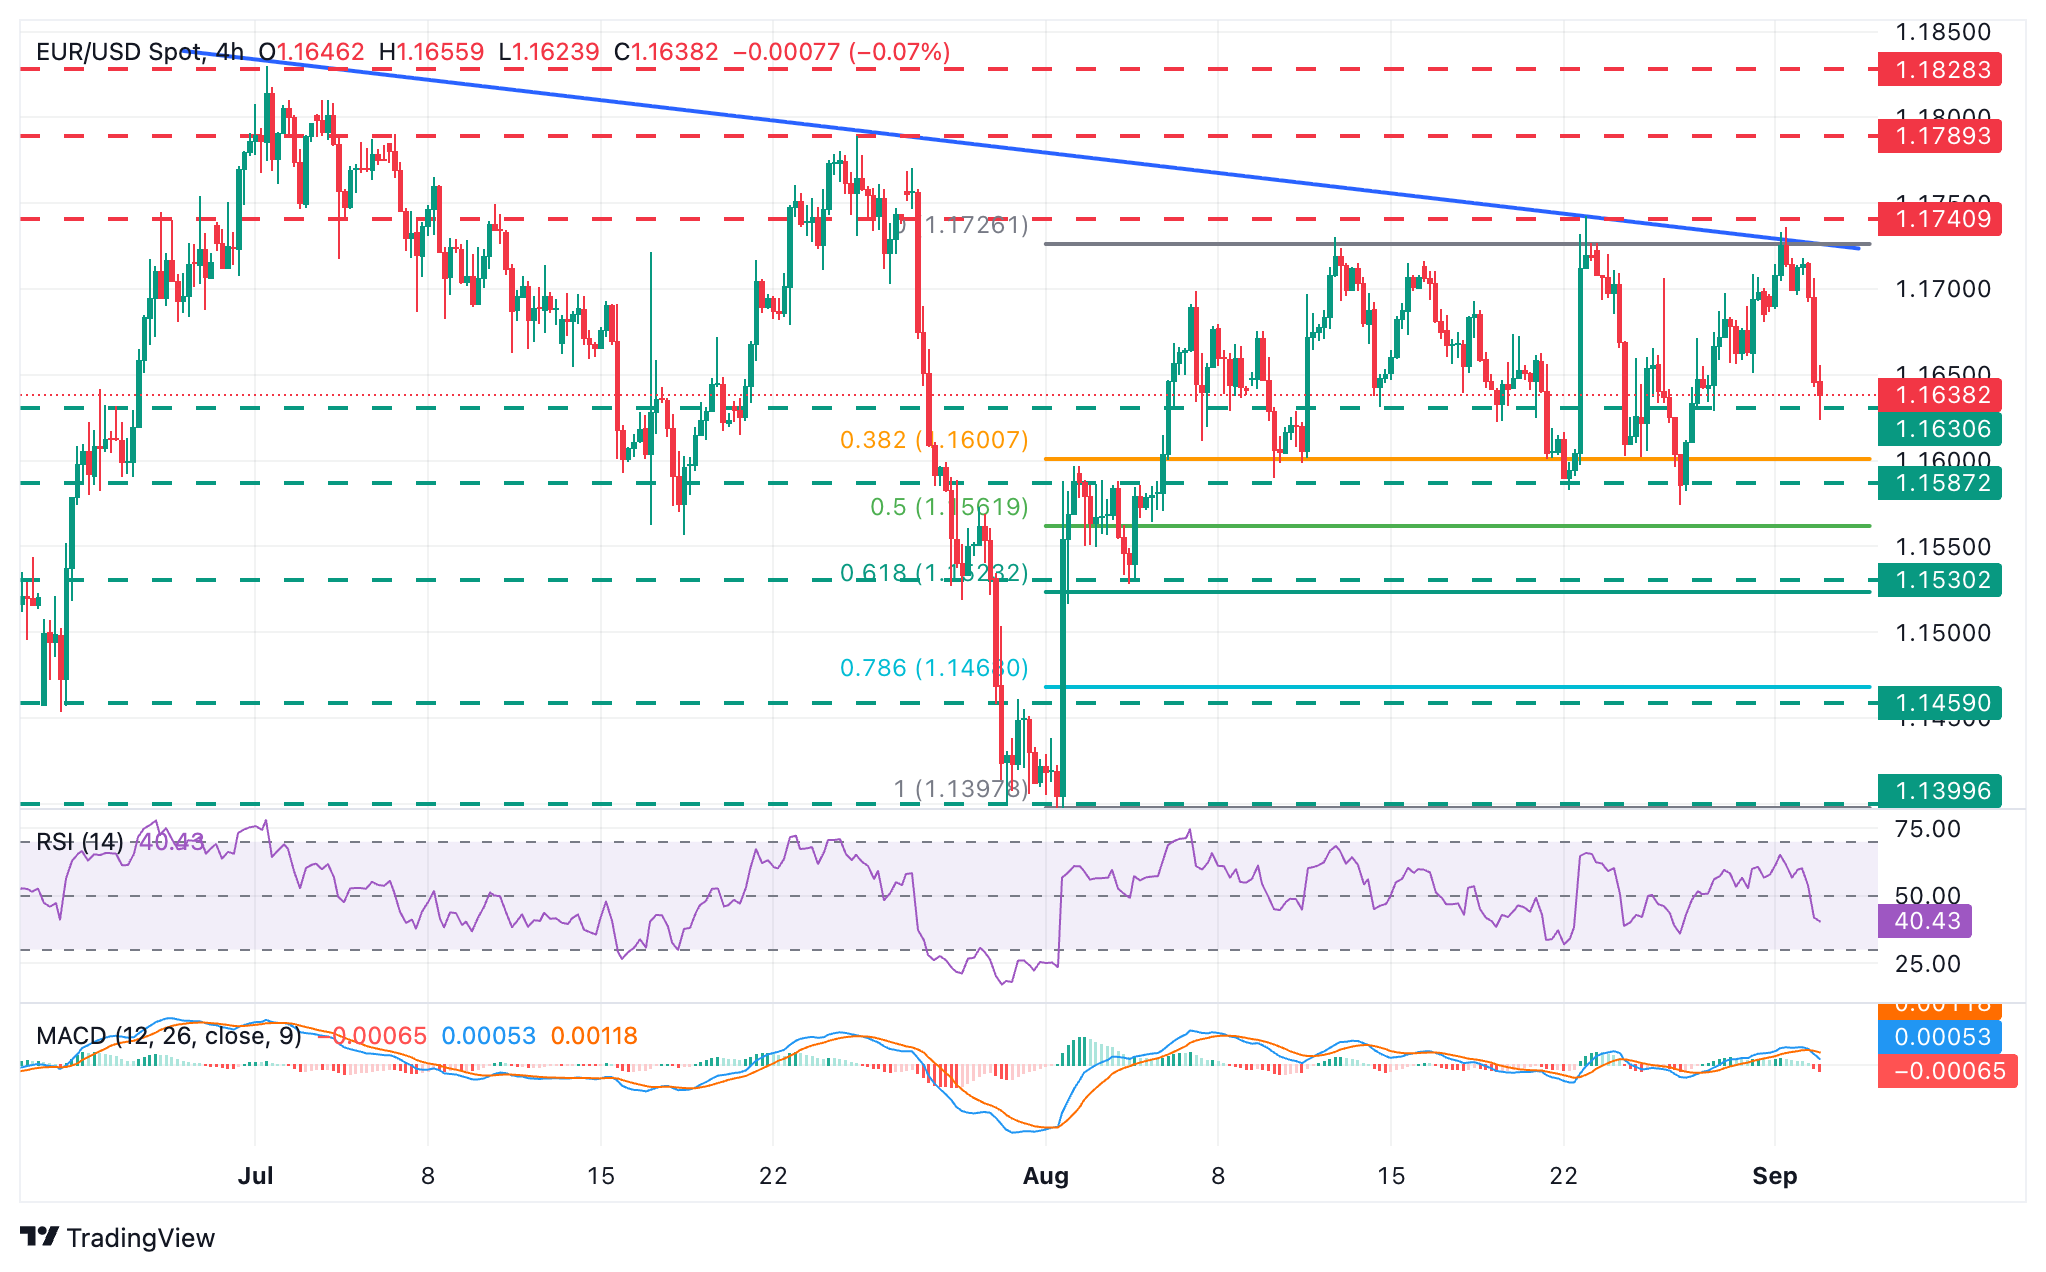
The EUR/USD is under increasing bearish pressure after its rejection at 1.1740 on Monday. Looking from a wider perspective, however, the pair remains looking for direction within the broadly 150-pip range that has contained price action for most of August.
Euro bears are likely to face significant support at the bottom of the monthly range, between 1.1575 and 1.1590, which capped bears on August 11, 22, and 27. Further down, the 50% Fibonacci retracement level of the early August bullish run, at 1.1560, might provide some support ahead of the August 5 low, near 1.1530.
To the upside, the confluence between the descending trendline resistance, now around 1.1730 and 1.1740, which encompasses the peaks of August 13 and 22, as well as Monday's high, is likely to pose a serious challenge for bulls. A confirmation beyond here would clear the way towards the late-July lows around 1.1790, ahead of the July 1 high at 1.1830.
Economic Indicator
ISM Manufacturing PMI
The Institute for Supply Management (ISM) Manufacturing Purchasing Managers Index (PMI), released on a monthly basis, is a leading indicator gauging business activity in the US manufacturing sector. The indicator is obtained from a survey of manufacturing supply executives based on information they have collected within their respective organizations. Survey responses reflect the change, if any, in the current month compared to the previous month. A reading above 50 indicates that the manufacturing economy is generally expanding, a bullish sign for the US Dollar (USD). A reading below 50 signals that factory activity is generally declining, which is seen as bearish for USD.
Read more.Next release: Tue Sep 02, 2025 14:00
Frequency: Monthly
Consensus: 49
Previous: 48
Source: Institute for Supply Management
The Institute for Supply Management’s (ISM) Manufacturing Purchasing Managers Index (PMI) provides a reliable outlook on the state of the US manufacturing sector. A reading above 50 suggests that the business activity expanded during the survey period and vice versa. PMIs are considered to be leading indicators and could signal a shift in the economic cycle. Stronger-than-expected prints usually have a positive impact on the USD. In addition to the headline PMI, the Employment Index and the Prices Paid Index numbers are watched closely as they shine a light on the labour market and inflation.
Economic Indicator
ISM Manufacturing Prices Paid
The Institute for Supply Management (ISM) Manufacturing Index shows business conditions in the US manufacturing sector, taking into account expectations for future production, new orders, inventories, employment and deliveries. It is a significant indicator of the overall economic condition in US. The ISM Prices Paid represents business sentiment regarding future inflation. A high reading is seen as positive for the USD, while a low reading is seen as negative.
Read more.Next release: Tue Sep 02, 2025 14:00
Frequency: Monthly
Consensus: 65.1
Previous: 64.8
Source: Institute for Supply Management
Author

Guillermo Alcala
FXStreet
Graduated in Communication Sciences at the Universidad del Pais Vasco and Universiteit van Amsterdam, Guillermo has been working as financial news editor and copywriter in diverse Forex-related firms, like FXStreet and Kantox.


