EUR/USD Price Analysis: Weekly triangle, 50-SMA challenge bulls around 1.1000
- EUR/USD remains mildly bid inside short-term triangle as bulls attack the resistance line.
- Steady RSI suggests further recovery but 50-SMA adds to the upside filters.
- 61.8% Fibonacci retracement level, mid-March low can lure bears on breaking triangle to the south.

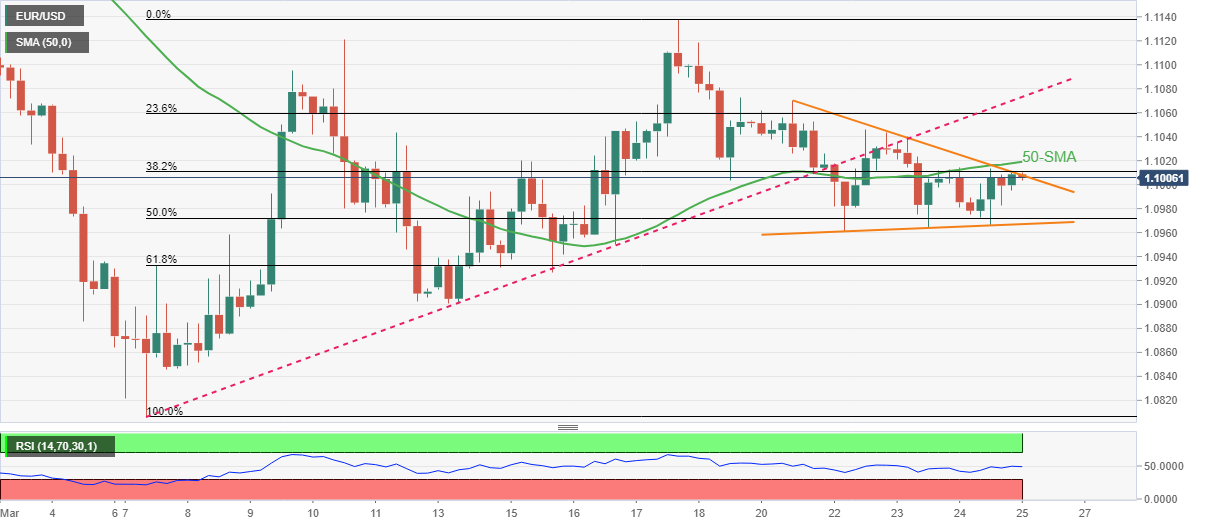
EUR/USD dribbles around 1.1010, up 0.10% intraday during Friday’s Asian session. In doing so, the major currency pair remains inside the weekly symmetrical triangle while keeping the previous day’s rebound.
Although steady RSI suggests the continuation of the EUR/USD recovery, the aforementioned triangle’s upper line and the 50-SMA, respectively around 1.1010 and 1.1020, challenge the pair’s short-term advances.
In a case where EUR/USD rises past 1.1020, the previous support line from March 07, close to 1.1075, will challenge the bulls before directing them to the monthly peak of 1.1137.
Alternatively, pullback moves remain elusive beyond the stated triangle’s support line, around 1.0965 by the press time.
Also acting as a downside filter is the 61.8% Fibonacci retracement of early-month advances, near 1.0930.
Should EUR/USD drop below 1.0930, the March 14 swing low near 1.0900 becomes the key hurdle for the bears targeting the monthly bottom of 1.0800.
EUR/USD: Four-hour chart
Trend: Further upside expected
Author

Anil Panchal
FXStreet
Anil Panchal has nearly 15 years of experience in tracking financial markets. With a keen interest in macroeconomics, Anil aptly tracks global news/updates and stays well-informed about the global financial moves and their implications.


