EUR/USD Price Analysis: Weekly indicators turn bearish
- EUR/USD's weekly MACD has turned bearish for the first since May.
- Key SMAs have rolled over in favor of the bears.

EUR/USD could extend last week's 1.77% decline, as crucial weekly chart indicators are now reporting bearish conditions.
The MACD histogram, which gauges trend strength and trend changes, has crossed below zero, indicating a bullish-to-bearish trend change. The index has turned negative for the first time since May.
Further, the 5- and 10-week simple moving averages (SMAs) have produced a bearish crossover for the first time since January.
As such, the pair is likely to test the former resistance-turned-support of 1.1495 (March high).
The pair is currently trading at 1.1632, having declined from 1.1872 to 1.1612 last week.
A close above last week's high of 1.1872 is needed to invalidate the bearish bias.
Weekly chart
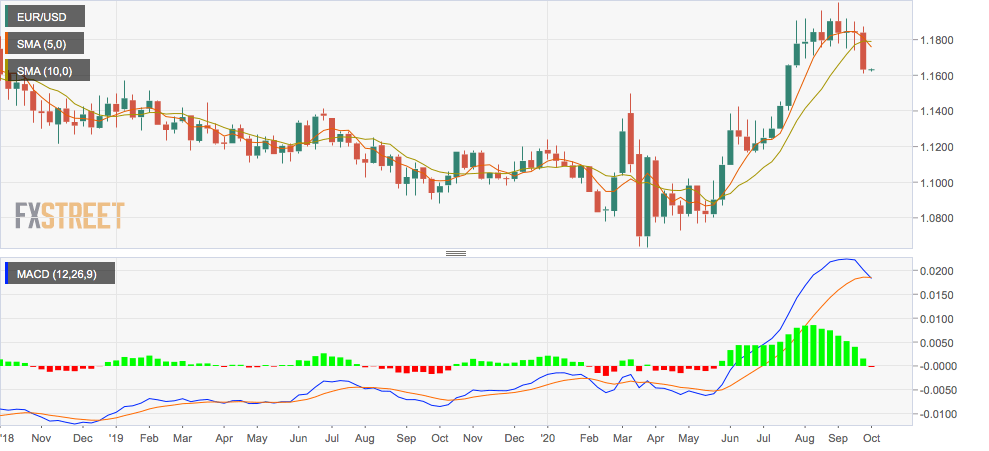
Trend: Bearish
Technical levels
Author

Omkar Godbole
FXStreet Contributor
Omkar Godbole, editor and analyst, joined FXStreet after four years as a research analyst at several Indian brokerage companies.


