|

EUR/USD Price Analysis: Treads water around 1.0200 inside weekly triangle

  • EUR/USD remains sidelined inside one-week-old symmetrical triangle, slowly pares Friday’s losses.
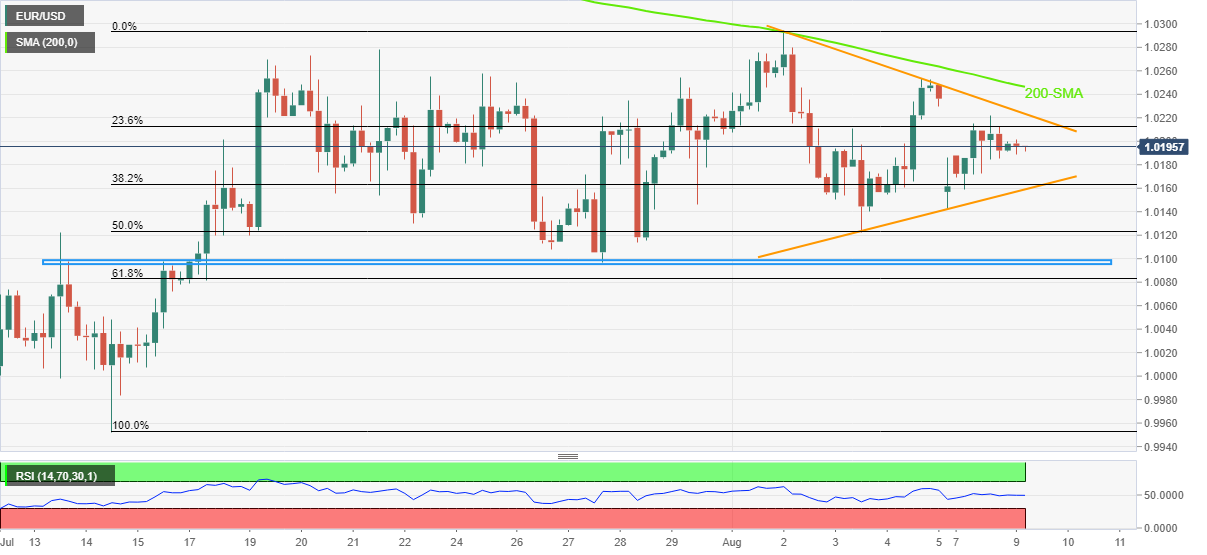
  • 200-SMA, monthly horizontal support add to the trading filters.
  • Steady RSI hints at further grinding, monthly peak appears last defense for bears.

EUR/USD treads water around 1.0200 heading into Tuesday’s European session, keeping Monday’s mildly positive outlook amid sluggish markets.

However, a one-week-old symmetrical triangle restricts immediate EUR/USD moves amid steady RSI.

Other than the stated triangle’s extremes around 1.0225 and 1.0160, the 200-SMA and a horizontal area including multiple levels marked since July 13 will also challenge EUR/USD moves around 1.0250 and 1.0100-0095.

That said, the monthly peak near the 1.0300 psychological magnet and the 61.8% Fibonacci retracement of July 14 to August 02 upside, near 1.0080, are extra filters for trading the major currency pair.

It’s worth noting that the market’s indecision ahead of the US Consumer Price Index (CPI), up for publishing on Wednesday, also appears to challenge the EUR/USD pair traders. Even so, the recent increase in the hawkish Fed bets and the recently firmer US jobs report, keeps sellers hopeful.

Also read: EUR/USD Forecast: In wait-and-see mode ahead of US CPI

In that case, the parity level and the latest multi-month bottom surrounding 0.9950 should gain major attention.

Meanwhile, recovery moves remain elusive until cross June’s low near 1.0360.

EUR/USD: Four-hour chart

Trend: Sideways

Additional important levels

Overview
Today last price1.0195
Today Daily Change-0.0001
Today Daily Change %-0.01%
Today daily open1.0196
 
Trends
Daily SMA201.0168
Daily SMA501.0364
Daily SMA1001.0554
Daily SMA2001.0922
 
Levels
Previous Daily High1.0222
Previous Daily Low1.0159
Previous Weekly High1.0294
Previous Weekly Low1.0123
Previous Monthly High1.0486
Previous Monthly Low0.9952
Daily Fibonacci 38.2%1.0198
Daily Fibonacci 61.8%1.0183
Daily Pivot Point S11.0163
Daily Pivot Point S21.013
Daily Pivot Point S31.0101
Daily Pivot Point R11.0226
Daily Pivot Point R21.0255
Daily Pivot Point R31.0288

Author

Anil Panchal

Anil Panchal

FXStreet

Anil Panchal has nearly 15 years of experience in tracking financial markets. With a keen interest in macroeconomics, Anil aptly tracks global news/updates and stays well-informed about the global financial moves and their implications.

More from Anil Panchal
Share:

Editor's Picks

EUR/USD accelerates losses, focus is on 1.1800

EUR/USD’s selling pressure is gathering pace now, opening the door to a potential test of the key 1.1800 region sooner rather than later. The pair’s pullback comes on the back of marked gains in the US Dollar following US data releases and the publication of the FOMC Minutes later in the day.

GBP/USD turns negative near 1.3540

GBP/USD reverses its initial upside momentum and is now adding to previous declines, revisiting at the same time the 1.3540 region on Wednesday. Cable’s downtick comes on the back of decent gains in the Greenback and easing UK inflation figures, which seem to have reinforced the case for a BoE rate cut in March.

Gold picks pace, flirts with $5,000

Gold is back on the front foot on Wednesday, shaking off part of the early week softness and pushing higher towards the key $5,000 mark per troy ounce. The move comes ahead of the FOMC Minutes and is unfolding despite an intense rebound in the US Dollar.

Fed Minutes to shed light on January hold decision amid hawkish rate outlook

The Minutes of the Fed’s January 27-28 monetary policy meeting will be published today. Details of discussions on the decision to leave the policy rate unchanged will be scrutinized by investors.

Mixed UK inflation data no gamechanger for the Bank of England

Food inflation plunged in January, but service sector price pressure is proving stickier. We continue to expect Bank of England rate cuts in March and June. The latest UK inflation read is a mixed bag for the Bank of England, but we doubt it drastically changes the odds of a March rate cut.

Sui extends sideways action ahead of Grayscale’s GSUI ETF launch

Sui is extending its downtrend for the second consecutive day, trading at 0.95 at the time of writing on Wednesday. The Layer-1 token is down over 16% in February and approximately 34% from the start of the year, aligning with the overall bearish sentiment across the crypto market.