|

EUR/USD Price Analysis: The first upside barrier is located above 1.0900

  • EUR/USD holds positive ground near 1.0895 in Friday’s early European session. 
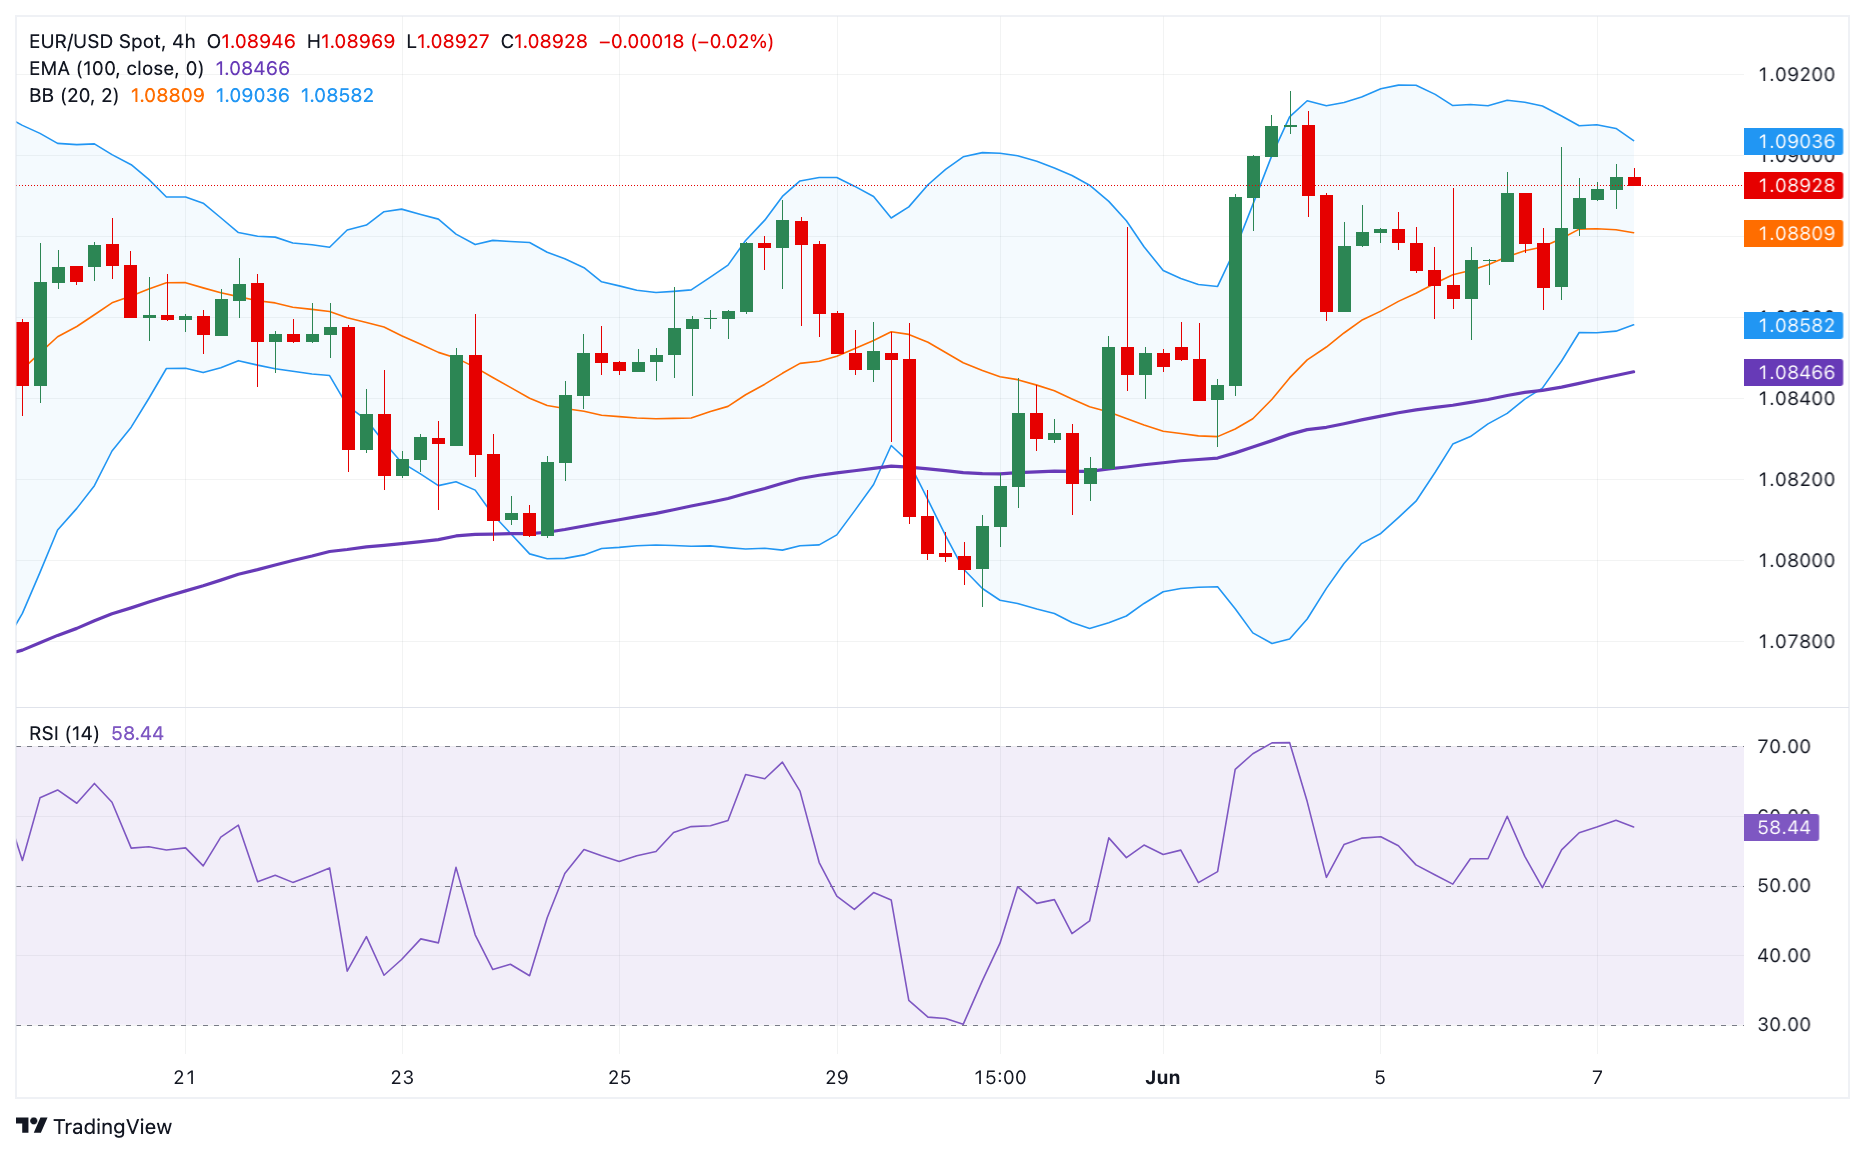
  • The pair maintains a positive stance on the 4-hour chart above the 100-period EMA, with a bullish RSI indicator. 
  • The first resistance level is seen in the 1.0900-1.0905 zone; the initial support level is located near 1.0860. 

The EUR/USD pair trades in positive territory for the second consecutive day around 1.0895 during the early European session on Friday. The European Central Bank (ECB) decided to cut interest rates by 25 basis points (bps) at its June meeting on Thursday, as widely anticipated by markets. However, traders did not expect a July rate cut, and the rate differential between the Euro and USD is unlikely to widen as much as initial expectations. This, in turn, provides some support to the Euro against the Greenback. 

From the technical perspective, EUR/USD keeps the bullish vibe unchanged on the 4-hour chart as the major pair holds above the key 100-period Exponential Moving Average (EMA). Additionally, the upward momentum is supported by the Relative Strength Index (RSI), which stands in the bullish zone near 60, suggesting the path of least resistance is to the upside. 

The first upside barrier will emerge at the 1.0900-1.0905 region, representing the upper boundary of the Bollinger Band and psychological level. Further north, the next hurdle is seen near 1.0940, a high of March 21. The additional upside filter to watch is 1.0964 (high of March 13), followed by 1.0981 (high of March 8). 

On the flip side, the initial support level for the pair is located around 1.0860, portraying the confluence of a low of June 6 and the lower limit of Bollinger Band. The next contention level to watch is the 100-period EMA at 1.0846. Any follow-through selling below this level will attract some sellers to 1.0811, a low of May 31. 

EUR/USD 4-hour chart

EUR/USD

Overview
Today last price1.0893
Today Daily Change0.0003
Today Daily Change %0.03
Today daily open1.089
 
Trends
Daily SMA201.0847
Daily SMA501.0778
Daily SMA1001.0808
Daily SMA2001.0788
 
Levels
Previous Daily High1.0902
Previous Daily Low1.0862
Previous Weekly High1.0889
Previous Weekly Low1.0788
Previous Monthly High1.0895
Previous Monthly Low1.065
Daily Fibonacci 38.2%1.0887
Daily Fibonacci 61.8%1.0877
Daily Pivot Point S11.0867
Daily Pivot Point S21.0844
Daily Pivot Point S31.0827
Daily Pivot Point R11.0907
Daily Pivot Point R21.0925
Daily Pivot Point R31.0947

Author

Lallalit Srijandorn

Lallalit Srijandorn is a Parisian at heart. She has lived in France since 2019 and now becomes a digital entrepreneur based in Paris and Bangkok.

More from Lallalit Srijandorn
Share:

Markets move fast. We move first.

Orange Juice Newsletter brings you expert driven insights - not headlines. Every day on your inbox.

By subscribing you agree to our Terms and conditions.

Editor's Picks

EUR/USD moves sideways below 1.1800 on Christmas Eve

EUR/USD struggles to find direction and trades in a narrow channel below 1.1800 after posting gains for two consecutive days. Bond and stock markets in the US will open at the usual time and close early on Christmas Eve, allowing the trading action to remain subdued. 

GBP/USD keeps range around 1.3500 amid quiet markets

GBP/USD keeps its range trade intact at around 1.3500 on Wednesday. The Pound Sterling holds the upper hand over the US Dollar amid pre-Christmas light trading as traders move to the sidelines heading into the holiday season. 

Gold retreats from record highs, trades below $4,500

Gold retreats after setting a new record-high above $4,520 earlier in the day and trades in a tight range below $4,500 as trading volumes thin out ahead of the Christmas break. The US Dollar selling bias remains unabated on the back of dovish Fed expectations, which continues to act as a tailwind for the bullion amid persistent geopolitical risks.

Bitcoin slips below $87,000 as ETF outflows intensify, whale participation declines

Bitcoin price continues to trade around $86,770 on Wednesday, after failing to break above the $90,000 resistance. US-listed spot ETFs record an outflow of $188.64 million on Tuesday, marking the fourth consecutive day of withdrawals.

Economic outlook 2026-2027 in advanced countries: Solidity test

After a year marked by global economic resilience and ending on a note of optimism, 2026 looks promising and could be a year of solid economic performance. In our baseline scenario, we expect most of the supportive factors at work in 2025 to continue to play a role in 2026.

Avalanche struggles near $12 as Grayscale files updated form for ETF

Avalanche trades close to $12 by press time on Wednesday, extending the nearly 2% drop from the previous day. Grayscale filed an updated form to convert its Avalanche-focused Trust into an ETF with the US Securities and Exchange Commission.