EUR/USD Price Analysis: Teasing symmetrical triangle breakout on 4H chart
- EUR/USD bulls struggling to extend control.
- A potential symmetrical triangle in play on the 4H chart.
- Acceptance above 1.2174 is critical, as focus shifts to Fed.

EUR/USD is trying hard to extend Tuesday’s bounce above 1.2150 but in vain, as the bulls remain nervous in the run-up to the Fed showdown.
The Fed is likely to strike a dovish tone, which could further weigh down on the greenback. At the time of writing, the main currency pair trades at 1.2160, almost unchanged on the day.
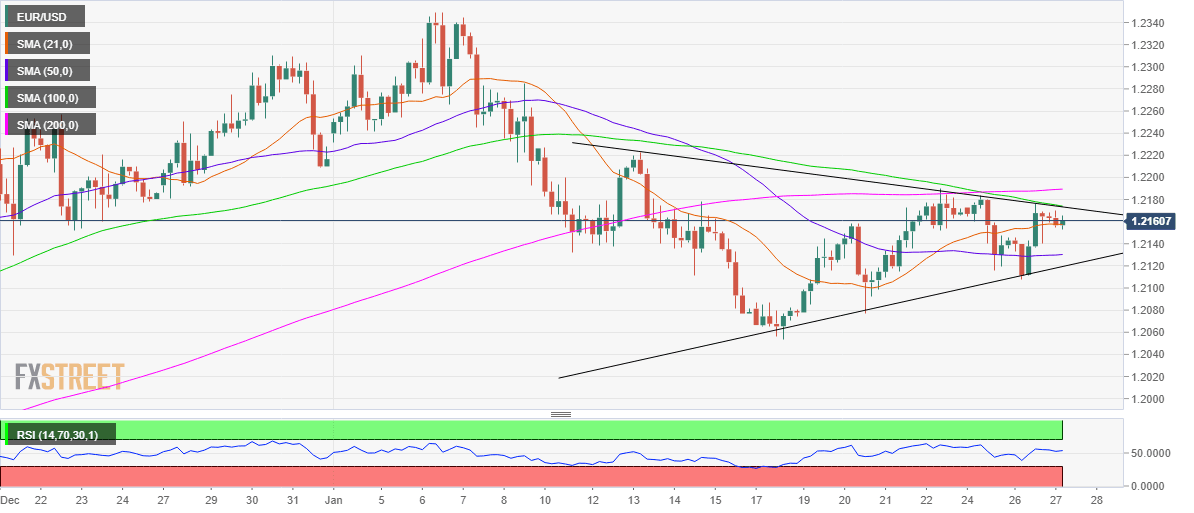
From a near-term technical perspective, the spot is hovering in the upper band of the recent trading range, having carved a potential symmetrical triangle formation on the four-hour chart.
A bullish breakout will be confirmed only if the price takes out the falling trendline (triangle) resistance at 1.2174 on a sustained basis. At that level, the 100-simple moving average (SMA) coincides.
At the moment, the euro pair is clinging onto the 21-SMA at 1.2157, awaiting a strong trading impetus. The upside break could call for a test of the 200-SMA at 1.2189, above which the 1.2200 could be probed.
Alternatively, the horizontal 50-SMA at 1.2130 would offer initial support. Further south, a breach of the rising trendline support at 1.2119 could yield a breakdown, opening floors towards January lows near mid-1.2100s.
The Relative Strength Index (RSI) points higher above the midline, suggesting that there is additional room to the upside.
EUR/USD: Four-hour chart
EUR/USD: Additional levels
Author

Dhwani Mehta
FXStreet
Residing in Mumbai (India), Dhwani is a Senior Analyst and Manager of the Asian session at FXStreet. She has over 10 years of experience in analyzing and covering the global financial markets, with specialization in Forex and commodities markets.


